Brands, Services and Products
Key Financial Information
Letter to Shareholders
Report of the Chief Operating Officer
Retail and Consumption Division
Industrial and Manufacturing Division
Infrastructure and Construction Division
Board of Directors
Report of the Corporate and Auditing Practices Committee
Consolidated Financial Statements
HOME
SPANISH
CONTACT

Key Financial
Information

Results
Results
Results
Graphs
Graphs
Graphs
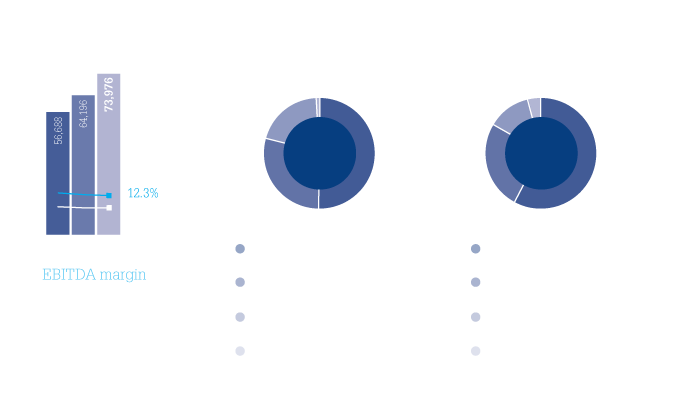
| (Thousand pesos at December 31, 2011*) | |||
| 2009 | 2010 | 2011 | |
| Sales | 56,687,753 | 64,196,109 | 73,975,726 |
| Operating Income | 6,133,505 | 6,887,028 | 7,948,024 |
| Controlling Participation in Net Income | 6,066,686 | 6,742,721 | 4,580,108 |
| EBITDA | 7,467,550 | 8,203,386 | 9,083,830 |
| Total Assets | 97,887,134 | 81,481,558 | 72,331,027 |
| Total Liabilities | 38,086,060 | 42,690,751 | 30,060,593 |
| Stockholder's Equity | 59,801,074 | 38,790,807 | 42,270,434 |
| Outstanding Shares | 2,323,718,400 | 2,302,750,000 | 2,291,502,200 |
| Earnings per share** | 2.62 | 2.93 | 2.00 |
* Except for outstanding shares and earnings per share.
** Controlling participation in Net Income divided by the weighted average shares outstanding.