| (Amounts in thousand pesos, except earnings per share, which is shown in pesos, and outstanding shares) | 2013 | 2014 | 2015 | Var% 2015 vs 2014 |
|---|---|---|---|---|
| Sales | 85,870,545 | 82,387,858 | 88,223,816 | 7.1% |
| Gross Profit | 22,905,636 | 23,206,133 | 25,562,314 | 10.2% |
| Operating Income | 17,277,276 | 9,089,522 | 10,329,259 | 13.6% |
| EBITDA | 18,699,382 | 10,606,017 | 12,570,512 | 18.5% |
| Controlling Participation in Net Income | 13,929,481 | 5,684,990 | 6,196,155 | 9.0% |
| Earnings per share (EPS)* | 6.08 | 2.48 | 2.72 | 9.7% |
| Margins | ||||
| Gross | 26.7% | 28.2% | 29.0% | 0.8 pp |
| Operating | 20.1% | 11.0% | 11.7% | 0.7 pp |
| EBITDA | 21.8% | 12.9% | 14.2% | 1.3 pp |
| Net | 16.2% | 6.9% | 7.0% | 0.1 pp |
| Revenues | ||||
| Retail | 40,514,434 | 41,202,547 | 44,413,058 | 7.8% |
| Industrial | 26,722,998 | 25,956,926 | 26,951,014 | 3.8% |
| Infrastructure and Construction | 18,818,223 | 14,799,667 | 16,492,889 | 11.4% |
| EBITDA** | ||||
| Retail | 5,500,202 | 5,027,548 | 5,707,369 | 13.5% |
| Industrial | 2,154,407 | 2,821,982 | 4,052,744 | 43.6% |
| Infrastructure and Construction | 3,356,985 | 2,221,607 | 2,297,009 | 3.4% |
| EBITDA margin | ||||
| Retail | 13.6% | 12.2% | 12.9% | 0.7 pp |
| Industrial | 8.1% | 10.9% | 15.0% | 4.1 pp |
| Infrastructure and Construction | 17.8% | 15.0% | 13.9% | -1.1 pp |
| Total Assets | 90,180,792 | 91,710,398 | 94,184,910 | 1.7% |
| Total Liabilities | 33,539,814 | 30,525,037 | 30,390,542 | -9.0% |
| Stockholders’ Equity | 56,640,978 | 61,185,361 | 63,794,368 | 8.0% |
| Compounded Average Outstanding Shares (‘000) | 2,289,802 | 2,289,802 | 2,281,190 | 0.0% |
EPS: Calculated as Controlling Participation in Net Income divided by the compounded average shares outstanding.
EBITDA: Income before income taxes plus depreciation and amortization, interest expense, impairment of machinery and equipment and exploration expenses, and effect on valuation of derivative financial instruments, less interest income, net foreign exchange gain, surplus from appraisals of shopping centers and equity in earnings of associated companies and joint ventures. Conciliation in Note 30 of the Financial Statements.
Variation in percentage points.

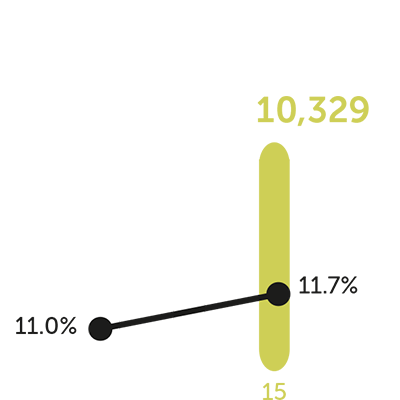
 Operating margin

EBITDA margin