| (Thousand pesos at December 31 of each year, except EPS) | 2012 | 2013 | 2014 | Var% 2014-2013 |
|---|---|---|---|---|
| Sales | 83,315,882 | 85,870,545 | 82,387,858 | -4.1% |
| Gross Profit | 22,236,093 | 22,905,636 | 23,206,133 | 1.3% |
| Operating Income | 9,102,765 | 17,277,276 | 9,089,522 | -47.4% |
| EBITDA | 10,537,283 | 18,699,382 | 10,606,017 | -43.3% |
| Controlling Participation in Net Income | 7,640,589 | 13,929,481 | 5,684,990 | -59.2% |
| Earnings per Share (EPS)* | 3.34 | 6.08 | 2.48 | -59.2% |
| Margins | ||||
| Gross | 26.7% | 26.7% | 28.2% | 1.5 |
| Operating | 10.9% | 20.1% | 11.0% | -9.1 |
| EBITDA | 12.6% | 21.8% | 12.9% | -8.9 |
| Net | 9.2% | 16.2% | 6.9% | -9.3 |
| Revenues | ||||
| Retail | 39,411,287 | 40,514,434 | 41,202,547 | 1.7% |
| Industrial | 27,415,038 | 26,722,998 | 25,956,926 | -2.9% |
| Infrastructure and Construction | 16,669,940 | 18,818,223 | 15,552,633 | -17.4% |
| EBITDA** | ||||
| Retail | 5,225,703 | 5,500,202 | 5,027,548 | -8.6% |
| Industrial | 2,559,740 | 2,154,407 | 2,821,982 | 31.0% |
| Infrastructure and Construction | 2,669,664 | 3,356,985 | 2,715,840 | -19.1% |
| Margin EBITDA | ||||
| Retail | 13.3% | 13.6% | 12.2% | -1.4 |
| Industrial | 9.3% | 8.1% | 10.9% | 2.8 |
| Infrastructure and Construction | 16.0% | 17.8% | 17.5% | -0.4 |
| Total Assets | 79,768,696 | 90,180,792 | 91,710,398 | 1.7% |
| Total Liabilities | 37,888,107 | 33,539,814 | 30,525,037 | -9.0% |
| Stockholders’ Equity | 41,880,589 | 56,640,978 | 61,185,361 | 8.0% |
| Outstanding Shares (‘000) | 2,289,802 | 2,289,802 | 2,289,802 | 0.0% |
* EPS: Calculated as Controlling Participation in Net Income divided by the number of shares outstanding.
** EBITDA: Comprehensive income plus depreciation and amortization, income taxes, interest expense, foreign exchange loss, loss on valuation of derivative financial instruments and the effect of conversion in companies abroad, less interest income, foreign exchange gain and gain on valuation of derivative financial instruments. Does not include Other Income from appraisal value of investment properties.
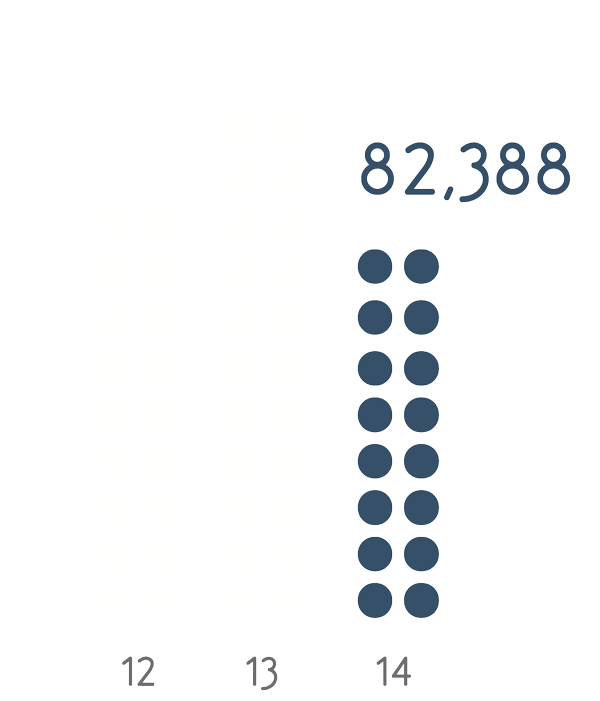
SALES
(million pesos)

OPERATING INCOME*
(million pesos)![]() Operating margin
Operating margin

EBITDA*
(million pesos)![]() Ebitda margin
Ebitda margin

SALES BREAKDOWN BY SUBSIDIARY
(million pesos)

OPERATING INCOME BREAKDOWN BY SUBSIDIARY*
(million pesos)
* Note: To calculate the margins in 2014 a total of $210 million pesos were added to the consolidated operating income and EBITDA due to the adjustment on the sale of Philip Morris Mexico (PMM) and $226 were subtracted per the valuation of investment properties. To calculate the margins in 2013 a total of $7,589 million pesos were subtracted to the consolidated operating income and EBITDA due to the sale of PMM as well as $210 on the valuation of investment properties.