CONSOLIDATED
FINANCIAL STATEMENTS
Independent Auditors’ Report to the Board of Directors and Stockholders of Grupo Carso, S. A. B. de C. V. and Subsidiaries
Opinion
We have audited the accompanying consolidated financial statements of Grupo Carso, S. A. B. de C. V. and its subsidiaries (the “Entity” or “Grupo Carso”), which comprise the consolidated statements of financial position as of December 31, 2025, 2024 and 2023, and the related consolidated statements of income and other comprehensive income, the consolidated statements of changes in stockholders’ equity and the consolidated statements of cash flows for the years then ended, together with the notes to the consolidated financial statements, including a summary of material accounting policies.
In our opinion, the accompanying consolidated financial statements present fairly, in all material respects, the consolidated financial position of Grupo Carso, S. A. B. de C. V. and subsidiaries as of December 31, 2025, 2024 and 2023, together with its consolidated financial performance and consolidated cash flows for the years then ended, in accordance with the International Financial Reporting Standards (IFRS) issued by the International Accounting Standards Board.
Basis for opinion
We conducted our audits in accordance with International Standards on Auditing (ISAs). Our responsibilities under those standards are further described in the Auditors’ Responsibilities for the Audit of the Consolidated Financial Statements section of our report. We are independent of the Entity in accordance with the Code of Ethics for Professional Accountants issued by the International Ethics Standards Board for Accountants’ (IESBA Ethics Code) and with the ethical requirements that are relevant to our audit of the consolidated financial statements in accordance with the Code of Ethics issued by the Mexican Institute of Public Accountants (IMCP Code), and we have fulfilled our other ethical responsibilities in accordance with the IESBA Ethics Code and IMCP Code. We believe that the audit evidence we have obtained is sufficient and appropriate to provide a basis for our opinion.
Key audit matter
Key audit matters are those that, in our professional judgment, were of most significance in our audit of the consolidated financial statements of the current period. These matters were addressed in the context of our audit of the consolidated financial statements as a whole, and in forming our opinion thereon, and we do not provide a separate opinion on these matters. We have determined that the key audit matter described as follows is the key audit matter that should be communicated in our report.
Impairment of long-lived assets including goodwill and intangible assets (see Notes 3, 15 and 19)
The Entity has identified the cash-generating units for which an impairment analysis is performed annually, as required by International Accounting Standard 36, “Impairment of Assets.” This analysis calculates discounted future cash flows to determine whether the value of the assets has been impaired. We focus on determining the materiality of impairment losses on long-lived assets, intangible assets, and goodwill specifically for Grupo Sanborns and Condumex as of December 31, 2025, given the risk that the assumptions used by management to calculate future cash flows may not be reasonable based on current and foreseeable future conditions.
The most significant assumptions relate to the discount and long-term growth rates applied and the business assumptions supporting future cash flows, particularly the revenue growth rate and projected cost and expense ratios. Our audit procedures to hedge the risk in relation to the impairment of long-lived assets included, among others:
- We reviewed the impairment models carried out by the administration, for those CGUs whose book values are subject to significant judgment.
- We have discussed key management assumptions regarding cash flow forecasts, discount rates, and long-term growth rates based on our knowledge of the business, industry, and audited historical information.
- We involved our specialists to challenge the assumptions used by management to validate the reasonableness of the information with the behavior of the business and industry market, including the current business situation in conjunction with the audit team.
Additional information other than the consolidated financial statements and the independent auditors’ report
The Entity’s management is responsible for other information. Other information includes, i) the sustainability information that the Group is obliged to prepare pursuant to Article 33, Section I, paragraph a) the information that will be incorporated in the Annual Report that the Entity is required to prepare pursuant to Article 33, Section I, paragraph b) of Title Four, Chapter One of the General Provisions Applicable to Issuers and other Participants of the Securities Market in Mexico and the Instructions accompanying these provisions (the Provisions). The sustainability information as well as the Annual Report is expected to be available for our reading after the date of this audit report; ii) other additional information, which is a measure that is not required by IFRS, and has been incorporated for the purpose of evaluating the performance of each of the operating segments, in relation to its Earnings before Financing, Taxes, Depreciation and Amortization (EBITDA) of the Entity, this information is presented in Note 34.
Our opinion on the consolidated financial statements does not cover the other information and we will not express any form of assurance in this regard.
In relation to our audit of the consolidated financial statements, our responsibility to read the sustainability information; as well as the Annual Report, when available, and when we do so, consider whether the other information contained therein is materially inconsistent with the consolidated financial statements or our knowledge obtained during the audit, or that it appears to contain a material misstatement. When we read the Annual Report, we will issue the legend on the reading of the Annual Report, required in Article 33 Section I, subsection b) numeral 1.2. of the Provisions. Also, and in connection with our audit of the consolidated financial statements, our responsibility is to read and recalculate the other additional information, which in this case is the measure not required by IFRS and in doing so consider whether the other information contained therein is materially inconsistent with the consolidated financial statements or with our knowledge obtained during the audit, or that appears to contain a material error. If, based on the work we do, we conclude that the other information contains a material error, we are obliged to report this fact. However, we have nothing to report concerning this matter.
Responsibilities of Management and Those Charged with Governance for the Consolidated Financial Statements
Management is responsible for the preparation and fair presentation of the consolidated financial statements in accordance with IFRS, and for the internal control deemed necessary by management to enable the preparation of consolidated financial statements that are free of material misstatement, whether due to fraud or error.
In preparing the consolidated financial statements, management is responsible for assessing the Entity’s ability to continue as a going concern, disclosing, as applicable, matters related to going concern and using the going concern basis of accounting unless management either intends to liquidate the Entity or to cease operations, or has no realistic alternative but to do so.
Those charged with governance are responsible for overseeing the Entity’s consolidated financial reporting process.
Auditors’ Responsibilities for the Audit of the Consolidated Financial Statements
Our objectives are to obtain reasonable assurance about whether the consolidated financial statements as a whole are free from material misstatement, whether due to fraud or error, and to issue an auditors’ report that includes our opinion. Reasonable assurance is a high level of assurance, but is not a guarantee that an audit conducted in accordance with ISAs will always detect material misstatement when it exists. Misstatements can arise from fraud or error and are considered material if, individually or in the aggregate, they could reasonably be expected to influence the economic decisions of users taken on the basis of these consolidated financial statements.
As part of an audit performed in accordance with ISA, we exercise professional judgment and maintain professional skepticism throughout the audit. We also:
- Identify and assess the risks of the material misstatement of the consolidated financial statements, whether due to fraud or error, design and perform audit procedures responsive to those risks, and obtain sufficient, appropriate audit evidence to provide a basis for our opinion. The risk of not detecting a material misstatement resulting from fraud is higher than for one resulting from error, as fraud may involve collusion, forgery, intentional omissions, misrepresentations, or the override of internal control.
- Obtain an understanding of internal control relevant to the audit in order to design audit procedures that are appropriate in the circumstances, but not for the purpose of expressing an opinion on the effectiveness of the Entity’s internal control.
- Evaluate the appropriateness of accounting policies used and the fairness of accounting estimates and related disclosures made by management.
- Conclude on the appropriateness of management’s use of the going concern basis of accounting and, based on the audit evidence obtained, whether a material uncertainty exists related to events or conditions that may cast significant doubt on the Entity’s ability to continue as a going concern. If we conclude that a material uncertainty exists, we are required to draw attention to our auditors’ report to the related disclosures in the consolidated financial statements or, if such disclosures are inadequate, to modify our opinion. Our conclusions are based on the audit evidence obtained up to the date of our auditors’ report. However, future events or conditions may cause the Entity to cease to continue as a going concern.
- Evaluate the overall presentation, structure and content of the consolidated financial statements, including the disclosures and whether the consolidated financial statements represent relevant transactions and events in a manner that achieves a fair presentation.
- Plan and perform the group audit to obtain sufficient appropriate audit evidence regarding the financial information of the entities or business units within the group as a basis for forming an opinion on the group financial statements. We are responsible for the direction, supervision and review of the audit work performed for purposes of the group audit. We remain solely responsible for our audit opinion.
We communicate with those charged with governance regarding, among other matters, the planned scope and timing of the audit and significant audit findings, including any significant deficiencies in internal control that we identify during our audit.
We also provide those charged with governance with a statement that we have complied with relevant ethical requirements regarding independence, and to communicate with them all relationships and other matters that may reasonably be thought to bear on our independence, and where applicable, related safeguards.
Among the matters communicated with those charged with governance, we determined those matters that were of most significance in the current period audit of the consolidated financial statements and are therefore the key audit matters. We described these matters in our auditors’ report unless law or regulation precludes public disclosure about the matter or when, in extremely rare circumstances, we determine that a matter should not be communicated in our report because the adverse consequences of doing so would reasonably be expected to outweigh the public interest benefits of such communication.
Galaz, Yamazaki, Ruiz Urquiza, S. C.
Affiliated with a Member Firm to Deloitte Touche Tohmatsu
Limited
C. P. A. Julio C. Fuentes Cortés
Mexico City, Mexico
March 20, 2026
Grupo Carso, S. A. B. de C. V. and Subsidiaries
Consolidated Statements of Financial Position
As of December 31, 2025, 2024 and 2023
(In thousands of Mexican pesos)
| Assets | Notes | 2025 | 2024 | 2023 |
|---|---|---|---|---|
| Current assets: | ||||
| Cash and cash equivalents | 5 | $ 23,596,680 | $ 16,241,709 | $ 16,347,047 |
| Accounts receivable | 6 | 44,934,283 | 53,254,674 | 48,839,490 |
| Due from related parties | 26 | 2,846,677 | 2,570,547 | 6,744,929 |
| Recoverable taxes | 8 | 6,648,716 | 6,469,926 | 5,319,829 |
| Inventories | 9 | 29,326,721 | 31,275,402 | 27,843,224 |
| Prepaid expenses | 2,890,931 | 1,981,540 | 2,154,367 | |
| Derivative financial instruments | 14 | 11,702 | 280 | 78,921 |
| Assets held for sale | 2 b and c | 557,075 | 10,688,754 | - |
| Total current assets | 110,812,785 | 122,482,832 | 107,327,807 | |
| Non-current assets: | ||||
| Net investment in leased asset | 7 | 13,967,455 | 15,978,816 | 13,289,011 |
| Long-term accounts receivable | 412,048 | 741,948 | 1,686,456 | |
| Real estate inventories | 971,283 | 971,283 | 971,283 | |
| Property, plant and equipment | 15 | 71,532,249 | 72,228,534 | 59,324,301 |
| Right-of-use assets | 10 | 4,995,611 | 6,368,422 | 5,954,258 |
| Investment properties | 16 | 7,886,716 | 5,143,649 | 4,958,956 |
| Investment in associated entities, joint ventures and other | 17 | 38,338,040 | 37,515,563 | 38,680,720 |
| Employee retirement benefits | 24 | 1,077,901 | 1,158,363 | 1,229,582 |
| Derivative financial instruments | 14 | 6,473 | 43,210 | 597,323 |
| Intangible assets | 19 | 7,663,252 | 9,387,358 | 8,965,402 |
| Deferred income tax asset | 31 | 7,797,736 | 7,282,843 | 6,775,088 |
| Other assets | 18 | 1,403,095 | 1,037,019 | 713,577 |
| Total of non-current assets | 156,051,859 | 157,857,008 | 143,145,957 | |
| Total assets | $ 266,864,644 | $ 280,339,840 | $ 250,473,764 | |
| Liabilities and stockholders’ equity | Notes | 2025 | 2024 | 2023 |
|---|---|---|---|---|
| Current liabilities: | ||||
| Loans payable to financial institutions | 20 | $ 14,208,176 | $ 11,499,274 | $ 17,859,325 |
| Current portion of long-term debt | 20 | 1,184,934 | 876,361 | 1,237,853 |
| Current lease obligation | 11 | 1,796,538 | 2,171,684 | 1,559,427 |
| Trade accounts payable | 21 | 19,141,316 | 21,500,712 | 18,653,841 |
| Accounts payable to related parties | 26 | 2,199,077 | 2,283,382 | 1,662,115 |
| Other accounts payable and accrued liabilities | 22 | 10,043,808 | 10,127,039 | 9,911,238 |
| Provisions | 23 | 9,015,138 | 8,318,584 | 7,192,045 |
| Direct employee benefits | 1,925,100 | 2,258,221 | 2,221,763 | |
| Derivative financial instruments | 14 | 449 | 14,611 | 786 |
| Contractual liabilities – customer advances | 2,818,975 | 2,785,523 | 2,735,419 | |
| Liabilities attributable to assets held for sale | 2b and c | - | 3,603,448 | - |
| Total current liabilities | 62,333,511 | 65,438,839 | 63,033,812 | |
| Non-current liabilities: | ||||
| Long-term debt | 20 | 21,413,859 | 35,281,525 | 26,653,124 |
| Lease obligation | 11 | 4,106,887 | 4,326,310 | 4,169,837 |
| Deferred income taxes | 31 | 10,933,092 | 12,111,509 | 10,947,813 |
| Other long-term liabilities | 359,242 | 565,789 | 563,424 | |
| Employee retirement benefits | 24 | 731,097 | 599,721 | 936,492 |
| Derivative financial instruments | 14 | - | - | 13,542 |
| Total non-current liabilities | 37,544,177 | 52,884,854 | 43,284,232 | |
| Total liabilities | 99,877,688 | 118,323,693 | 106,318,044 | |
| Stockholders’ equity | 25 | |||
| Capital stock | 25 | 2,528,261 | 2,528,678 | 2,529,104 |
| Net stock issuance premium | 3,769,987 | 3,769,987 | 3,769,987 | |
| Retained earnings | 131,716,889 | 126,906,607 | 116,007,892 | |
| Accumulated other comprehensive income | 7,365,287 | 9,136,696 | 6,149,561 | |
| Controlling interest | 145,380,424 | 142,341,968 | 128,456,544 | |
| Non-controlling interest | 21,606,532 | 19,674,179 | 15,699,176 | |
| Total consolidated stockholders’ equity | 25 | 166,986,956 | 162,016,147 | 144,155,720 |
| Total liabilities and stockholders’ equity | $ 266,864,644 | $ 280,339,840 | $ 250,473,764 | |
The accompanying notes are part of the consolidated financial statements
Grupo Carso, S. A. B. de C. V. and Subsidiaries
Consolidated Statements of Income and Other Comprehensive Income
As of December 31, 2025, 2024 and 2023
(In thousands of Mexican pesos, except for the basic profit per share, which is expressed in pesos)
| Notes | 2025 | 2024 | 2023 | |
|---|---|---|---|---|
| Income | 27 | $ 191,626,600 | $ 198,034,805 | $ 193,414,365 |
| Cost of sales | 28 | 146,511,390 | 148,768,485 | 141,299,649 |
| Gross operating income | 45,115,210 | 49,266,320 | 52,114,716 | |
| Sales expenses | 28 | 19,148,811 | 18,461,056 | 16,811,541 |
| Administrative expenses | 28 | 8,278,074 | 6,711,386 | 8,305,381 |
| Statutory employee profit-sharing | 595,782 | 723,043 | 799,115 | |
| Other (income) expenses, net | 29 | (1,261,755) | (159,520) | 848,327 |
| Financial costs | 4,606,573 | 6,252,714 | 5,792,888 | |
| Financial income | (1,162,603) | (1,594,081) | (1,747,503) | |
| Exchange gain | (3,198,627) | (8,167,723) | (3,574,108) | |
| Exchange loss | 5,669,678 | 5,551,500 | 5,603,692 | |
| Effects of valuation of derivative financial instruments | (3,624) | (717,240) | (78,093) | |
| Equity in results of associated entities, joint ventures and other | 17 | (1,462,996) | (1,307,583) | (1,267,708) |
| Income before income taxes | 13,905,897 | 23,512,768 | 20,621,184 | |
| Income taxes | 31 | 2,389,750 | 6,902,167 | 6,047,166 |
| Profit from continuous operations | 11,516,147 | 16,610,601 | 14,574,018 | |
| Discontinued operations; Profit (loss) from discontinued operations, net | 30 | 754,506 | 117,629 | (688,702) |
| Consolidated net income of the year | $ 12,270,653 | $ 16,728,230 | $ 13,885,316 | |
| Other comprehensive income, net of income tax | ||||
| Items that will not be reclassified to results: | ||||
| (Loss) gain from cumulative translation adjustment | $ (1,163,347) | $ 4,623,658 | $ (2,698,180) | |
| Notes | 2025 | 2024 | 2023 | |
|---|---|---|---|---|
| Gain (loss) from derivative financial instruments valuation, net of deferred taxes | 14 | 3,204 | (112,699) | (303,939) |
| (Loss) gain in the fair value of equity financial instruments, net of deferred taxes | 14 | 1,163,573 | (2,819,683) | 257,805 |
| Items that will not be reclassified to results: | ||||
| Actuarial (losses) | (230,320) | (16,514) | (433,429) | |
| (Loss) gain on financial assets at fair value | (2,739) | 240,322 | (132,134) | |
| Other items | 577,425 | (91) | (1) | |
| Equity in other comprehensive income (losses) of associated entities and joint ventures | (2,240,044) | 2,849,634 | (1,832,319) | |
| Total other comprehensive income | (1,892,248) | 4,764,627 | (5,142,197) | |
| Consolidated comprehensive income of the year | $ 10,378,405 | $ 21,492,857 | $ 8,743,119 | |
| Consolidated net income attributable to: | ||||
| Controlling interest | $ 8,774,585 | $ 14,456,973 | $ 13,519,384 | |
| Non-controlling interest | 3,496,068 | 2,271,257 | 365,932 | |
| $ 12,270,653 | $ 16,728,230 | $ 13,885,316 | ||
| Basic profit per ordinary share attributable to controlling interest: | ||||
| Through continuous operations. | $ 3.892 | $ 6.408 | $ 6.002 | |
| Through discontinuous operations. | $ 0.335 | $ 0.052 | $ 0.306 | |
| Basic profit per ordinary share | $ 4.227 | $ 6.460 | $ 6.002 | |
| Weighted average number of outstanding shares (‘000) | 2,254,792 | 2,256,167 | 2,252,660 | |
| Consolidated comprehensive income attributable to: | ||||
| Controlling interest | $ 7,003,176 | $ 17,444,108 | $ 9,229,535 | |
| Non-controlling interest | 3,375,229 | 4,048,749 | (486,416) | |
| $ 10,378,405 | $ 21,492,857 | $ 8,743,119 | ||
The accompanying notes are part of the consolidated financial statements
Grupo Carso, S. A. B. de C. V. and Subsidiaries
Consolidated Statements of Changes in Stockholders’ Equity
For the years ended December 31, 2025, 2024 and 2023
(In thousands of Mexican pesos)
| Capital stock | Net stock issuance premium | Retained earnings | Gain (losses) in translation effects of foreign operations | (Losses) gain in valuation of derivative financial instruments | Actuarial (losses) gain | Gain in valuation of capital financial instruments | (Losses) gains on financial assets at fair value | Equity in other comprehensive income | Equity in other comprehensive income of associated entities | Total controlling interest | Non-controlling interest | Total stockholders’ equity | |
|---|---|---|---|---|---|---|---|---|---|---|---|---|---|
| Balances as of December 31, 2022 | $ 2,527,195 | $ 2,392,896 | $ 105,528,869 | $ (844,532) | $ 271,149 | $ (314,703) | $ 11,390,875 | $ (98,347) | $ (868,669) | $ 903,637 | $ 120,888,370 | $ 13,965,873 | $ 134,854,243 |
| Repurchase of own shares | (693) | - | (317,953) | - | - | - | - | - | - | - | (318,646) | - | (318,646) |
| Dividends declared in cash and shares | 2,602 | 1,377,091 | (2,702,084) | - | - | - | - | - | - | - | (1,322,391) | - | (1,322,391) |
| Dividends declared to non-controlling interest | - | - | - | - | - | - | - | - | - | - | - | (513,104) | (513,104) |
| Decrease in repurchase of shares of subsidiary | - | - | - | - | - | - | - | - | - | - | - | - | - |
| Acquisition of non-controlling interest of subsidiaries | - | - | (20,324) | - | - | - | - | - | - | - | (20,324) | 2,732,823 | 2,712,499 |
| Balances before comprehensive income | 2,529,104 | 3,769,987 | 102,488,508 | (844,532) | 271,149 | (314,703) | 11,390,875 | (98,347) | (868,669) | 903,637 | 119,227,009 | 16,185,592 | 135,412,601 |
| Comprehensive income of the year | - | - | 13,519,384 | (1,987,950) | (225,278) | (455,974) | 257,685 | (125,830) | (904) | (1,751,598) | 9,229,535 | (486,416) | 8,743,119 |
| Balances as of December 31, 2023 | 2,529,104 | 3,769,987 | 116,007,892 | (2,832,482) | 45,871 | (770,677) | 11,648,560 | (224,177) | (869,573) | (847,961) | 128,456,544 | 15,699,176 | 144,155,720 |
| Repurchase of own shares | (426) | - | (235,618) | - | - | - | - | - | - | - | (236,044) | - | (236,044) |
| Dividends declared in cash and shares | - | - | (3,383,669) | - | - | - | - | - | - | - | (3,383,669) | - | (3,383,669) |
| Dividends declared to non-controlling interest | - | - | - | - | - | - | - | - | - | - | - | (644,779) | (644,779) |
| Decrease in repurchase of shares of subsidiary | - | - | 618 | - | - | - | - | - | - | - | 618 | - | 618 |
| Acquisition of non-controlling interest of subsidiaries | - | - | 60,411 | - | - | - | - | - | - | - | 60,411 | 571,033 | 631,444 |
| Balances before comprehensive income | 2,528,678 | 3,769,987 | 112,449,634 | (2,832,482) | 45,871 | (770,677) | 11,648,560 | (224,177) | (869,573) | (847,961) | 124,897,860 | 15,625,430 | 140,523,290 |
| Comprehensive income of the year | - | - | 14,456,973 | 3,080,348 | (105,828) | (129,494) | (2,819,711) | 227,527 | 2,109 | 2,732,184 | 17,444,108 | 4,048,749 | 21,492,857 |
| Capital stock | Net stock issuance premium | Retained earnings | Gain (losses) in translation effects of foreign operations | (Losses) gain in valuation of derivative financial instruments | Actuarial (losses) gain | Gain in valuation of capital financial instruments | (Losses) gains on financial assets at fair value | Equity in other comprehensive income | Equity in other comprehensive income of associated entities | Total controlling interest | Non-controlling interest | Total stockholders’ equity | |
|---|---|---|---|---|---|---|---|---|---|---|---|---|---|
| Balances as of December 31, 2024 | 2,528,678 | 3,769,987 | 126,906,607 | 247,866 | (59,957) | (900,171) | 8,828,849 | 3,350 | (867,464) | 1,884,223 | 142,341,968 | 19,674,179 | 162,016,147 |
| Repurchase of own shares | (417) | - | (224,347) | - | - | - | - | - | - | - | (224,764) | - | (224,764) |
| Cash dividends declared | - | - | (3,381,596) | - | - | - | - | - | - | - | (3,381,596) | - | (3,381,596) |
| Dividends declared to non-controlling interest | - | - | - | - | - | - | - | - | - | - | - | (1,691,401) | (1,691,401) |
| Decrease in repurchase of shares of subsidiary | - | - | 26 | - | - | - | - | - | - | - | 26 | - | 26 |
| Acquisition of non-controlling interest of subsidiaries | - | - | (358,386) | - | - | - | - | - | - | - | (358,386) | 248,525 | (109,861) |
| Balances before comprehensive income | 2,528,261 | 3,769,987 | 122,942,304 | 247,866 | (59,957) | (900,171) | 8,828,849 | 3,350 | (867,464) | 1,884,223 | 138,377,248 | 18,231,303 | 156,608,551 |
| Comprehensive income of the year | - | - | 8,774,585 | (1,155,004) | 13,400 | (223,884) | 1,163,508 | (2,739) | 577,296 | (2,143,986) | 7,003,176 | 3,375,229 | 10,378,405 |
| Balances as of December 31, 2025 | $ 2,528,261 | $ 3,769,987 | $ 131,716,889 | $ (907,138) | $ (46,557) | $ (1,124,055) | $ 9,992,357 | $ 611 | $ (290,168) | $ (259,763) | $ 145,380,424 | $ 21,606,532 | $ 166,986,956 |
The accompanying notes are part of the consolidated financial statements
Grupo Carso, S. A. B. de C. V. and Subsidiaries
Consolidated Statements of Cash Flows
For the years ended December 31, 2025, 2024 and 2023
(In thousands of Mexican pesos)
| 2025 | 2024 | 2023 | |
|---|---|---|---|
| Cash flows from operating activities: | |||
| Consolidated net income of the year | $ 12,270,653 | $ 16,728,230 | $ 13,885,316 |
| Adjustments from: | |||
| Profit (loss) from discontinued operations, net | (754,506) | (117,629) | 688,702 |
| Income tax recognized in results | 2,389,750 | 6,902,167 | 6,047,166 |
| Depreciation and amortization | 7,074,351 | 6,827,113 | 5,307,629 |
| Profit on sale of permanent investments | (2,270,761) | - | - |
| Loss (gain) on sale of property, plant and equipment and other assets | 1,571 | 4,112 | 1,903 |
| Impairment of property, plant and equipment | 386,801 | (16,750) | 127,169 |
| Deterioration of exploration expenditures | 1,116,446 | - | - |
| Gain from change in fair value of investment property | (411,537) | (69,103) | (170,601) |
| Equity in profits of associated entities and joint ventures | (1,462,966) | (1,307,698) | (1,267,708) |
| Interest income | (3,804,561) | (3,993,741) | (5,898,035) |
| Interest expense | 4,606,573 | 6,252,714 | 5,792,888 |
| Dividends received from associated entities measured at fair value | (1,331,944) | (1,331,946) | (1,331,948) |
| Other items | 2,363 | 579,877 | 240,933 |
| 17,812,233 | 30,457,346 | 23,423,414 | |
| Items related to operating activities: | |||
| (Increase) decrease in: | |||
| Cuentas por cobrar | 8,957,161 | (3,494,492) | (10,034,235) |
| Interest income | 2,674,642 | 2,399,660 | 3,977,763 |
| Other accounts receivable | (959,437) | (593,511) | 148,956 |
| Due from related parties | (276,130) | 4,174,382 | 911,650 |
| Recoverable taxes | 61,407 | (1,285,106) | (457,993) |
| Inventories | 1,948,681 | (3,432,178) | (699,685) |
| Prepaid expenses | (909,391) | 172,827 | 161,968 |
| Account receivable of the leased asset | 2,353,993 | (3,368,693) | 2,281,803 |
| Long-term accounts receivable | 329,900 | 944,508 | (242,889) |
| Other assets | (366,076) | (323,442) | (380,856) |
| (Decrease) increase in | |||
| Trade accounts payable | (2,359,396) | 2,845,353 | 1,439,019 |
| Accounts payable to related parties | (84,305) | 621,267 | 772,820 |
| Other accounts payable and accrued liabilities | (83,231) | (199,234) | 137,130 |
| Provisions | 696,554 | 1,123,113 | (2,185,037) |
| 2025 | 2024 | 2023 | |
|---|---|---|---|
| Direct employee benefits | (333,121) | 36,458 | 245,184 |
| Advances from customers | 33,452 | 50,104 | 207,430 |
| Other long-term liabilities | (206,547) | 2,365 | (206,008) |
| Employee retirement benefits | 131,376 | 60,999 | (14,392) |
| Income taxes paid | (5,121,001) | (5,692,059) | (6,921,791) |
| Derivative financial instruments | 11,153 | 520,338 | 53,740 |
| Net cash flows from operating activities | 24,311,917 | 25,020,005 | 12,617,991 |
| Cash flows from investment activities: | |||
| Purchase of property, plant and equipment | (8,163,268) | (6,476,008) | (5,550,786) |
| Proceeds on disposal of property, plant and equipment | 52,374 | 202,994 | 120,415 |
| Divestment (investment) in exploration expenses | (24,125) | (454,830) | 37,842 |
| Interest received | 1,159,385 | 1,594,632 | 1,749,649 |
| Dividends received | 2,193,383 | 2,023,798 | 1,931,094 |
| Acquisition of subsidiaries | - | (10,876,022) | - |
| Contribution and/or acquisition of the shares of subsidiaries, associated entities and joint ventures | (361,768) | (338,463) | (1,398,919) |
| Cash and cash equivalents held for sale | - | (443,293) | - |
| Sale of shares of subsidiary | 4,878,675 | - | 2,000 |
| Non-controlling participation increment | 248,525 | 571,033 | 2,732,823 |
| Financial assets at fair value | - | - | (132,135) |
| Net cash flows used in investment activities | (16,819) | (14,196,159) | (508,017) |
| Cash flows from financing activities: | |||
| Loans obtained from financial and other institutions | 71,783,143 | 78,992,853 | 89,300,092 |
| Payment of loans and other long-term debt contracted with financial institutions | (82,633,335) | (78,706,233) | (86,340,140) |
| Interest paid | (4,004,914) | (5,692,059) | (5,246,291) |
| Payment of lease liabilities | (1,331,507) | (1,711,865) | (2,224,880) |
| Dividends paid | (5,072,997) | (4,028,448) | (1,805,606) |
| Repurchase of own shares | (224,854) | (236,044) | (318,646) |
| Net cash flows used in financing activities | (21,484,464) | (11,381,796) | (6,635,471) |
| Cash flow adjustments due to exchange rate variances | 4,544,337 | 452,612 | (1,422,099) |
| Net increase (decrease) in cash and cash equivalents | 7,354,971 | (105,338) | 4,052,404 |
| Cash and cash equivalents at the start of the year | 16,241,709 | 16,347,047 | 12,294,643 |
| Cash and cash equivalents at the end of the year | $ 23,596,680 | $ 16,241,709 | $ 16,347,047 |
The accompanying notes are part of the consolidated financial statements
Grupo Carso, S. A. B. de C. V. and Subsidiaries
Notes to the Consolidated Financial Statements
For the years ended December 31, 2025, 2024 and 2023
(In thousands of Mexican pesos ($) and thousands of U.S. dollars (US$) when indicated)
1.Nature of business
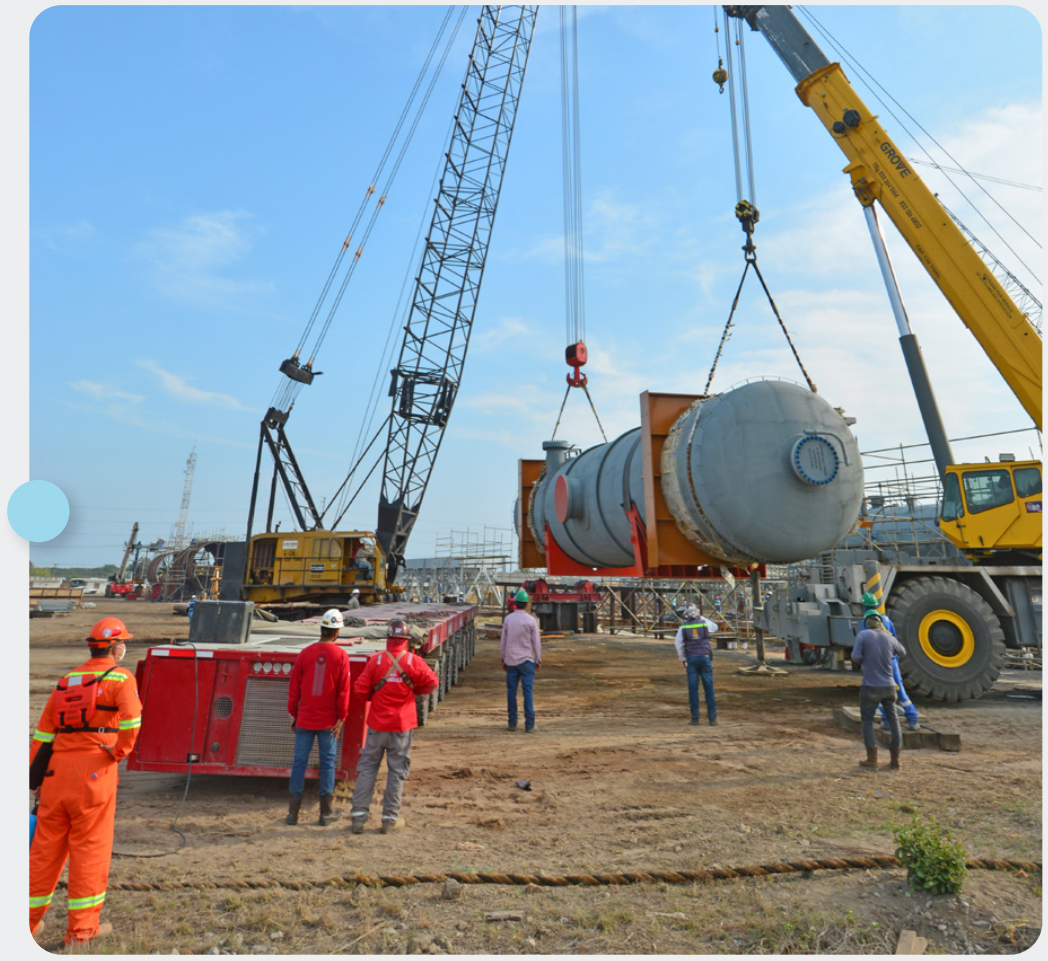
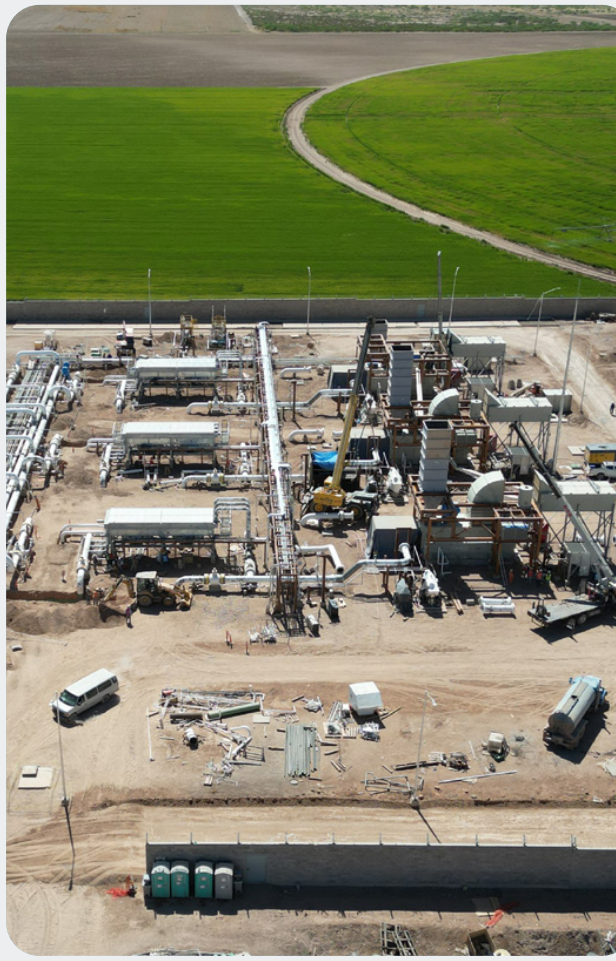
Grupo Carso, S. A. B. de C. V. and Subsidiaries (the Entity or Grupo Carso), with address at Lago Zurich No. 245 Edificio Frisco Piso 2, Col. Ampliación Granada in Mexico City, ZIP Code 11529, is a Public Stock Company incorporated in Mexico, which holds the shares of a group of companies that primarily operate in the Commercial, industrial, Infrastructure and Construction and Energy segments (see Note 4).
2.Significant events
- On September 29, 2025, GSM BRONCO, S.A. de C.V. (“GSM”) and MX DLTA NRG 1, S.A. de C.V. (“DLTA1”) (collectively, the “Service Provider”) entered into a contract with Petróleos Mexicanos (“PEMEX”), a Developed and Financed Services Contract for Well Drilling in the Ixachi Field (the “Contract”).
The Ixachi Field (the “Field”) is part of Pemex’s Assignment AE-0032-6M-Joachín-02. This field is considered one of the most important onshore fields in Mexico. The Contract covers the drilling and completion of up to 32 wells over a three-year period, which will contribute to a substantial increase in oil and gas production in the field. In accordance with the Contract, PEMEX will begin payments for the drilling of these financed wells in January 2027, with 21 monthly installments for each well delivered, starting from the corresponding date. By the date of the first payment, in January 2027, it is estimated that 12 wells under this Contract will be in production. If all 32 wells are drilled, the maximum Contract amount is US$1.991 billion, including financing. This amount will be lower if fewer wells are drilled, while maintaining the same financing formula. The source and payment mechanism for the Contract will be through the revenue obtained from marketable hydrocarbons within the assigned area. - Sale of subsidiary. On April 1, 2025, the sale of shares of GIANT’s business in the United States was completed; the price agreed upon at the time of the transaction was US$620,000; as part of the negotiation, an adjustment to the price was estimated at approximately US$149,187; of the remaining amount, approximately US$470,813.
In November 2024, the Entity reached a binding agreement with Heidelberg Materials US, Inc., for the sale of Giant Cement Holding, Inc., a subsidiary of Fortaleza Materiales, S. A. P. I. de C. V., which is indirectly a subsidiary of the Issuer, and/or any of its affiliated, subsidiary, controlled or controlling companies, for an approximate price of USD $600,000, subject to the fulfillment of the usual post-closing adjustments in this type of transactions.
It is worth noting that for the completion of this transaction, it was necessary to spin off Keystone Cement Company, LLC., and selected non-operational land was excluded from Giant Cement Company, Inc., Dragon Products Company, Inc., and Giant Resource Recovery, Inc.
Below is the integration of the assets held for sale, as of December 31, 2024, resulting from the aforementioned operation:
| Concept | Amount |
|---|---|
| Cash and Cash Equivalents | $ 443,293 |
| Customers (Net) | 675,161 |
| Taxes to Recover and Credit | 6,176 |
| Inventory | 869,134 |
| Other stock investments | 2,154 |
| Anticipated Expenses | 108,789 |
| Fixed Assets (Net) | 3,710,862 |
| Right-of-Use Assets | 294,580 |
| Trademarks | 1,174,330 |
| Computer Programs | 7,614 |
| Other Intangible Assets | 240,483 |
| Deferred Income Tax | 2,625,292 |
| Employee Benefits (Asset) | 87,865 |
| Other Non-Current Assets | 14,362 |
| Goodwill | 334,397 |
| $ 10,594,492 |
| Concept | Amount |
|---|---|
| Suppliers | $ 630,005 |
| Taxes and Fees | 18,901 |
| Various Creditors | 150,741 |
| Lease Liabilities | 47,525 |
| Short-term Employee Benefits | 81,390 |
| Deferred Income Tax | 1,964,772 |
| Employee Benefits | 288,446 |
| Lease Liabilities | 188,005 |
| Others | 233,663 |
| Liabilities attributable to assets held for sale | $ 3,603,448 |
- Below is the integration of the assets held for sale, as of December 31, 2024, resulting from the aforementioned operation:
30% of the average annual workforce was laid off. The total severance payments amounted to $97.5 million pesos, which were recorded under direct labor, administrative salaries, plant salaries, and sales salaries.
In December, operations at the Vallejo plant were discontinued, resulting in a significant impairment loss of $372 million pesos, which was recorded under other expenses.
The remaining value of the land and building of the Vallejo plant was reclassified as available-for-sale assets in accordance with IFRS 5, for a total of $464 million pesos, as of December 31, 2025. As of the date of this report, the Entity’s management and its parent company are evaluating several possible options for its sale to related and unrelated parties. - In December 2024, the Entity, through its subsidiary Zamajal, S.A. de C.V., an entity 90% owned by Grupo Carso and 10% by Control Empresarial de Capitales, S.A. de C.V., entered into a binding agreement with Talos Energy Inc. (“Talos”) (NYSE: TALO) to increase its stake by an additional 30.10% in Talos’s Mexican subsidiary, Talos Energy México 7, S. de R.L. de C.V. (“Talos México”), which holds a 17.4% stake in the Zama oil field (“Zama Field”).
Upon closing of the transaction, which is subject to the corresponding regulatory approvals in Mexico, Zamajal will have control and will hold 80% of the share capital of Talos Mexico.
- In July 2024, the Entity, in its capacity as Service Provider (the “Service Provider”), entered into with the State Productive Company subsidiary of Petróleos Mexicanos, Pemex Exploration and Production (“PEP”), through certain of its subsidiaries, the Comprehensive Exploration and Extraction Services Contract Lakach (the ‘CSIEE’) in the Contract Area comprised by the Assignment Area A-0188-M-Lakach Field (the “Lakach Field”).
BACKGROUND
The Lakach Field was discovered in 2007, spans 33.82 km2, and is located on the continental shelf of the southern Gulf of Mexico, 98 km southeast of Veracruz City and 50 km from the Municipality of Alvarado, in territorial waters of the Gulf of Mexico, considered as deep waters, with wells distributed throughout the area at water depths of between 900 to 1,200 meters currently capped to be recovered; the average depths of these wells range from 3,085 to 3,210 vertical meters below sea level.
- Investment by the Service Provider exceeding $1,200MM US dollars (USD), with PEP maintaining ownership of the reservoir and its reserves.
- Gas production will be directed to land.
- Construction by the Service Provider of an onshore Gas Conditioning Station for the treatment of gas and condensates for disposition under sale conditions.
- The first commercial production is estimated in approximately 2 and a half years.
Strategic Partners for the Project: For the execution of the CSIEE, the Service Provider will have the support of specialized companies in the field such as, among others:
Talos Energy, a US oil and gas company, specializing in exploration, development, and production services in deepwater reservoirs of the Gulf of Mexico.
FCC Construcción, a company with extensive experience in the infrastructure area, specializing in technical and technological capacity in engineering, civil works, and execution of large-scale projects.
- On June 20, 2024, following the binding agreement dated December 18, 2023, and due to the fulfillment of stipulated conditions and obtaining the corresponding regulatory authorizations, through its subsidiary Zamajal, S. A. de C. V., of which it holds 90% of its shareholding, it formalized the acquisition of 100% of the share capital of PetroBal Operaciones Upstream, S. A. de. C. V. (“PetroBal”), an entity that is part of Grupo Bal and owner of PetroBal Upstream Delta 1, S. A. de C. V. (“Delta 1”), an entity holding 50% participation in the Ichalkil & Pokoch fields (“Contractual Area 4”), located off the coast of Campeche, and which, together with the government of Mexico through the National Hydrocarbons Commission, and the consortium integrated by Fieldwood Energy E&P México, S. de R. L. de C. V., (as operating partner), and Delta 1, as financial partner, are part of the CNH-R01-L02-A4/2015 contract for the exploration and extraction of hydrocarbons under the shared production modality corresponding to the aforementioned Contractual Area 4.
On that same date, the operation was paid for with a purchase price of USD$601,289 and an amount of $11,071,422, according to its fair value, resulting in goodwill for an amount of $1,494,932. (See Note 3a)
- On December 21, 2023, an investment agreement, development agreement, and transportation service contract were signed with the Federal Electricity Commission (CFE) for the development, construction, and operation of a gas pipeline, approximately 416 kilometers long, subject to the fulfillment of certain suspensive conditions. This pipeline will be a continuation of the Samalayuca-Sásabe pipeline to Mexicali, Baja California Norte, Mexico. CFE has an initial option for up to a 15% stake in the project, which can be increased to 49% upon completion of the transportation service contract.
On September 11, 2023, Gasoducto Centauro del Norte, S.A. de C.V., was incorporated. The company’s purpose is to enter into contracts for the provision of natural gas pipeline transportation services to the Federal Electricity Commission, primarily for natural gas transportation services in the states of Sonora and Baja California.
- On May 24, 2023, the Entity signed a binding agreement with Talos Energy Inc. (“Talos”) (NYSE: TALO) to acquire 49.9% of the share capital of its Mexican subsidiary, Talos Energy Mexico 7, S. de R. L. de C. V. (“Talos Mexico”), entity that holds 17.4% stake in the Zama oil field (“Zama Site”).
On September 4, 2015, the Mexican government, through the National Hydrocarbons Commission (“CNH”), signed the CNH-R01-L01-A7/2015 contract with a consortium led by Talos Mexico (as operator), and now also composed of Wintershall DEA AG and Harbor Energy PLC, for the exploration and extraction of hydrocarbons under the shared production mode in the so-called Block 7, a contractual area located in shallow waters approximately 63.5 km from the coast of Tabasco, in the Southeast Basin.
From 2017 to 2019, the consortium developed exploration activities including drilling three wells in the Block, to the location of a potential shared reservoir over the area corresponding to the PEP AE-0152-Uchukil Allocation, which is a surface allocated to Pemex Exploration and Production (“PEP”) during round zero.
3. Business combination
Acquired subsidiaries
- As indicated in subsection a of Note 2d of significant events, the entity acquired 100% of the share capital of PetroBal through its subsidiary Zamajal, S. A. de C. V. This business acquisition was recorded in accordance with the International Financial Reporting Standard on Business Combinations (IFRS 3), resulting in goodwill from the operation amounting to $1,494,932 as of the acquisition date.
At the acquisition date, acquired assets and assumed liabilities are as follows:
| Carrying value | Fair value | |
|---|---|---|
| Current assets: | ||
| Cash and cash equivalents | $ 195,400 | 195,400 |
| Accounts receivable from customers | 708,682 | 708,682 |
| Other current assets | 381,033 | 381,033 |
| Non-current assets: | ||
| Property, plant and equipment | 9,506,778 | 9,506,778 |
| Right-of-use assets | 266,604 | 392,098 |
| Other assets | 53,486 | 53,486 |
| Intangibles | 1,124,783 | 575,492 |
| Current liabilities: | ||
| Debt | 1,491,600 | 1,491,600 |
| Account payable to suppliers and other accounts payable | 281,030 | 281,030 |
| Noncurrent liabilities: | ||
| Lease liabilities | 373,411 | 420,052 |
| Other liabilities | 43,797 | 43,797 |
| Net assets acquired | $ 10,046,928 | $ 9,576,490 |
The goodwill calculation as of December 31, 2024 is as follows:
| Fair value | |
|---|---|
| Consideration paid in cash | $ 11,071,422 |
| Less: net assets acquired | 9,576,490 |
| $ 1,494,932 |
Net cash flows on the acquisition of subsidiaries
| Fair value | |
|---|---|
| Consideration paid in cash | $ 11,071,422 |
| Less: acquired balances of cash and cash equivalents | 195,400 |
| $ 10,876,022 |
Effect of acquisitions in the Entity’s results
If this business combination had taken place on January 1, 2024, the Entity’s revenue from continuing operations would have amounted to $1,686,999, while the result for the year from continuing operations would have amounted to $(1,749,349). The Entity’s management believes that these “proforma” figures represent an approximate measure of the combined Entity’s performance on an annualized basis and provide a benchmark for comparison for future periods.
4. Consolidated subsidiaries
The equity held by Grupo Carso in the common stock of its subsidiaries as of December 31, 2025, 2024 and 2023 is detailed below
| Subsidiary | Country of incorporation and operations | Activity | Ownership % as of December 31, | ||
|---|---|---|---|---|---|
| 2025 | 2024 | 2023 | |||
| Carso Infraestructura y Construcción, S. A. de C. V. y Subsidiarias (CICSA) | Mexico, Central America and South America | Operation of several engineering areas including those related to infrastructure, such as: highway construction and maintenance, water systems, water treatment plants and dams; duct line installations for the telecommunications and gas sectors, including fiber-optic networks and gas pipelines, among others; oil well drilling and services related to the industry; design and construction of oil platforms and oil industry equipment; the construction of industrial, commercial and residential real property. | 99.97 | 99.97 | 99.97 |
| Grupo Condumex, S. A. de C. V. y Subsidiarias (Condumex) | Mexico, U.S., Central America, South America and Spain | Manufacture and sale of goods, mainly cable to construction, automotive, energy and telecommunications markets; manufacture of auto parts, mainly for the terminal industry, manufacture and sale of products derived from copper and aluminum products; manufacture and marketing of cement for the construction industry as well as light construction and development of constructive and innovative solutions used in all stages of construction. | 99.58 | 99.58 | 99.58 |
| Grupo Sanborns, S. A. de C. V. y Subsidiarias (Sanborns) | Mexico, El Salvador and Panama | Operation of department stores, gift shops, sales of cell phones and electronic devices, restaurants, cafes, and management of shopping centers primarily through the following commercial brands: Sanborns, Sears, Mix-up, Claro Shop, and iShop. | 99.97 | 99.97 | 99.97 |
| Carso Energy, S. A. de C. V. y Subsidiarias | Mexico, U.S. and Colombia | Holder of shares in companies in the electricity generation and natural gas transportation sector. | 96.17 | 95.70 | 95.68 |
| Zamajal, S. A. de C. V. | Mexico | Holder of shares of companies in the hydrocarbon exploration and extraction sector. | 78.95 | 90.02 | 77.08 |
5. Cash and cash equivalents
| 2025 | 2024 | 2023 | |
|---|---|---|---|
| Cash | $ 6,791,521 | $ 5,552,590 | $ 5,529,310 |
| Cash equivalents: | |||
| Investments at sight | 6,365,123 | 3,619,060 | 3,253,811 |
| Bank paper | 5,116,194 | 916,613 | 4,602,440 |
| Government paper | 465,693 | 4,760,736 | 560,276 |
| Bonds | - | 122,262 | 1,270,861 |
| Demand deposits in U.S. dollars | 4,844,337 | 1,270,373 | 1,128,920 |
| Others | 13,812 | 75 | 1,429 |
| Total | $ 23,596,680 | $ 16,241,709 | $ 16,347,047 |
These items primarily consist of bank deposits in checking accounts and investments in highlyliquid, short-term securities that are easily convertible to cash or have a maturity of up to three months from the acquisition date and are not subject to significant risks of changes in value. Cash is presented at face value, while equivalents are valued at fair value; value fluctuations are recognized in the results of the period. Cash equivalents are represented by daily money market investments, mainly bank and government sight investments paper denominated in U.S. pesos and dollars.
6. Accounts receivable
| 2025 | 2024 | 2023 | |
|---|---|---|---|
| Customers | $ 27,088,512 | $ 28,889,259 | $ 33,257,867 |
| Allowance for expected credit losses | (1,254,892) | (1,051,241) | (3,425,232) |
| 25,833,620 | 27,838,018 | 29,832,635 | |
| Uncertified completed work | 14,053,779 | 20,986,577 | 15,471,657 |
| Current portion of the net investment in leased assets | 2,642,340 | 2,984,972 | 2,306,084 |
| Sundry debtors | 1,902,222 | 1,006,247 | 826,323 |
| Others | 502,322 | 438,860 | 402,791 |
| $ 44,934,283 | $ 53,254,674 | $ 48,839,490 |
- Accounts receivable do not accrue interest and generally have a period of between 30 to 90 days.
- For the terms and conditions related to accounts receivable with related parties, see Note 26.
As of December 31, 2025, 2024 and 2023, the maximum credit risk exposure for customers was as follows:
| Carrying value | Allowance for doubtful accounts | |||||
|---|---|---|---|---|---|---|
| Category | 2025 | 2024 | 2023 | 2025 | 2024 | 2023 |
| Null | $ 21,100,258 | $ 22,400,664 | $ 17,102,995 | $ 128,339 | $ 41,660 | $ 50 |
| Low | 4,259,601 | 4,631,271 | 8,232,330 | 148,199 | 176,312 | 280,862 |
| Moderate 1 | 614,785 | 576,666 | 1,742,528 | 255,645 | 54,319 | 361,803 |
| Moderate 2 | 264,378 | 270,839 | 2,261,492 | 94,952 | 61,327 | 787,596 |
| High 1 | 618,980 | 639,762 | 1,239,173 | 466,339 | 396,984 | 563,634 |
| High 2 | 40,237 | 196,485 | 414,103 | 16,673 | 168,484 | 323,889 |
| Critical | 190,273 | 173,572 | 2,265,246 | 144,745 | 152,155 | 1,107,398 |
| $ 27,088,512 | $ 28,889,259 | $ 33,257,867 | $ 1,254,892 | $ 1,051,241 | $ 3,425,232 | |

As of December 31, 2025, the book value of the Entity’s most significant portfolio corresponds to the Null segment, for $21,100,258; as of December 31, 2024, the book value of the Entity’s most significant portfolio corresponds to the Null segment, for $22,400,664; as of December 31, 2023, the book value of the Entity’s most significant portfolio corresponds to the Null segment, for $17,102,995, which is equivalent to 77.89%, 77.54%, and 51.43% of the total portfolio, respectively, and to 10.23%, 3.96%, and 0.00% of the allowance for doubtful accounts recorded: $1,254,892 in 2025, $1,051,241 in 2024, and $3,425,232 in 2023). For the doubtful accounts estimate, the most significant segment is High 1 with an amount of $446,339 and a percentage of the doubtful accounts estimate of 37.16% in 2025, High 1 with an amount of $396,984 and a percentage of the doubtful accounts estimate of 37.76% in 2024 and Critical with an amount of $1,107,398 and a percentage of the doubtful accounts estimate of 32.33% in 2023.
The following summary indicates the Entity’s customer credit risk exposure.
| 2025 | 2024 | 2023 | ||||
|---|---|---|---|---|---|---|
| Item | No credit impairment | With credit impairment | No credit impairment | With credit impairment | No credit impairment | With credit impairment |
| Total client gross carrying amount | $ 21,100,208 | $ 5,988,304 | $ 23,019,136 | $ 5,870,123 | $ 17,662,613 | $ 15,595,254 |
| Allowance for credit losses | $ - | $ 1,254,892 | $ - | $ 1,051,241 | $ - | $ 3,425,232 |
Constant reviews are carried out to adapt the model to any internal or external changes that could result in a calibration.
The Entity uses the estimated factors described above to determine the allowance for expected credit losses.
The model used to determine the customer credit risks of each of the Group’s business units identifies each individual account receivable to ascertain its level of indebtedness, the customer’s payment capacity, the principal payment amount, maturity and payment behavior to establish the respective risk level and the discount factor used for the impairment of the financial assets associated with credit granting.
The following table provides information on credit risk exposure and expected credit losses for customers as of December 31, 2025, 2024 and 2023.
| Carrying value | Allowance for doubtful accounts | Discount factor | |||||||
|---|---|---|---|---|---|---|---|---|---|
| Concept | 2025 | 2024 | 2023 | 2025 | 2024 | 2023 | 2025 | 2024 | 2023 |
| Null | $ 21,100,258 | $ 22,400,664 | $ 17,102,995 | $ 128,339 | $ 41,660 | $ 50 | 0.61% | 0.19% | 0.00% |
| Low | 4,259,601 | 4,631,271 | 8,232,330 | 148,199 | 176,312 | 280,862 | 3.48% | 3.81% | 3.41% |
| Moderate 1 | 614,785 | 576,666 | 1,742,528 | 255,645 | 54,319 | 361,803 | 41.58% | 9.42% | 20.76% |
| Moderate 2 | 264,378 | 270,839 | 2,261,492 | 94,952 | 61,327 | 787,596 | 35.92% | 22.64% | 34.83% |
| High 1 | 618,980 | 639,762 | 1,239,173 | 466,339 | 396,984 | 563,634 | 75.34% | 62.05% | 45.48% |
| High 2 | 40,237 | 196,485 | 414,103 | 16,673 | 168,484 | 323,889 | 41.44% | 85.75% | 78.21% |
| Critical | 190,273 | 173,572 | 2,265,246 | 144,745 | 152,155 | 1,107,398 | 70.07% | 87.66% | 48.89% |
| Total | $ 27,088,512 | $ 28,889,259 | $ 33,257,867 | $ 1,254,892 | $ 1,051,241 | $ 3,425,232 | 4.63% | 3.64% | 10.30% |
7. Net investment in leased assets
Carso Gasoducto Norte, S. A. de C. V. (CGN) entered into contracts for the provision of natural gas transportation service with the Federal Electricity Commission (“CFE”) on September 23, 2015, for which it is responsible for the construction and operation of the natural gas pipeline and transportation system and will provide transport services at the request of CFE from whom it will receive as consideration a single rate that includes all these concepts. CFE is the main carrier and has most of the pipeline’s capacity; therefore, CGN determined that these agreements constitute a sale-type lease under IFRS 16. The contracts continue for a period of 25 years from the date of entry into service, which occurred on April 15, 2021. From the signing of the agreement, the CFE may terminate the contract in the event of an event of non-compliance in which CGN does not remedy within the corresponding period. In the event that the CFE terminates the contract, the CFE will demand the payment of the immediate and direct damages duly documented.
The lease is recorded in the balance sheet at the present value of future lease payments to be received, as determined by the service contracts, discounted at the annual interest rate implied in the lease, 13.00%. As the value of the investment in the lease and the value of the underlying asset were substantially equivalent, no gain or loss was recognized at the beginning of the lease.
CGN recognized $2,432,813, $2,338,461 and $2,166,726 in interest income for the year ended December 31, 2025, 2024 and 2023 respectively, to view the receivable of the current portion see Note 6 and the long-term portion see Statement of Financial Position.
The following table shows the lease future minimum payments in USD that are expected to be received in the following 4 years and afterwards.
| Maturity analysis | Revenues |
|---|---|
| Year 1 | $ 156,720 |
| Year 2 | 156,720 |
| Year 3 | 156,720 |
| Year 4 | 156,720 |
| Year 5 and afterwards | 2,546,700 |
| $ 3,173,580 |
8. Recoverable taxes
| 2025 | 2024 | 2023 | |
|---|---|---|---|
| Recoverable value added tax | $ 4,555,641 | $ 4,715,200 | $ 3,761,120 |
| Recoverable income tax | 1,307,273 | 1,067,076 | 1,202,847 |
| Other recoverable taxes | 785,802 | 687,650 | 355,862 |
| $ 6,648,716 | $ 6,469,926 | $ 5,319,829 |
9. Inventories
| 2025 | 2024 | 2023 | |
|---|---|---|---|
| Raw materials and auxiliary materials | $ 4,910,212 | $ 6,047,525 | $ 5,831,632 |
| Production-in-process | 2,983,167 | 2,427,732 | 1,843,223 |
| Finished goods | 3,848,365 | 4,190,298 | 3,135,894 |
| Goods in stores | 14,844,911 | 15,560,504 | 14,198,185 |
| Land and housing construction in progress | 7,341 | 7,341 | 20,286 |
| 26,593,996 | 28,233,400 | 25,029,220 | |
| Goods in-transit | 864,400 | 1,162,761 | 945,295 |
| Replacement parts and other inventories | 1,868,325 | 1,879,241 | 1,868,709 |
| $ 29,326,721 | $ 31,275,402 | $ 27,843,224 |
The costs of inventories recognized in results as a cost of sales are those shown in the consolidated statements of income and other comprehensive income as of December 31, 2025, 2024 and 2023, respectively.
10. Right-of-use assets
The Entity leases different properties. The average lease term in the commercial sector is 15 years, 8 years for the industrial sector, 4 years for the infrastructure and construction sector in 2025, 2024 and 2023 respectively, and 5 years for the Energy sector in 2025, 2024 and 2023
The Entity has the option of purchasing certain manufacturing equipment for a nominal amount at the end of the lease period. The Entity’s obligations are guaranteed by the lessor’s title to the assets covered by these leases.
Expired contracts were replaced by new lease arrangements with identical underlying assets. This resulted in the addition of rights-of-use assets of $940,018, $948,178 and $957,587 in 2025, 2024 and 2023, respectively.
The maturity analysis of the lease liabilities is presented in Note 11
| Right-of-use assets | Property and others |
|---|---|
| Cost: | |
| Balance as of January 1, 2023 | $ 11,912,579 |
| Additions | 1,451,853 |
| Disposals | (337,575) |
| Balance as of December 31, 2023 | 13,026,857 |
| Additions | 2,171,472 |
| Business Acquisition | 892,698 |
| Discontinuation | (839,949) |
| Disposals | (269,831) |
| Balance as of December 31, 2024 | 14,981,247 |
| Additions | 2,003,489 |
| Disposals | (2,902,820) |
| Balance as of December 31, 2025 | $ 14,081,916 |
| Accumulated depreciation: | |
| Balance as of January 1, 2023 | $ (5,709,874) |
| Depreciation of the period | (1,385,520) |
| Disposals | 22,795 |
| Balance as of December 31, 2023 | (7,072,599) |
| Depreciation of the period | (1,973,903) |
| Discontinuation | 449,125 |
| Disposals | (15,448) |
| Balance as of December 31, 2024 | (8,612,825) |
| Depreciation of the period | (1,342,951) |
| Disposals | 869,471 |
| Balance as of December 31, 2025 | $ (9,086,305) |
| Net cost: | |
| Balance as of December 31, 2025 | $ 4,995,611 |
| Balance as of December 31, 2024 | $ 6,368,422 |
| Balance as of December 31, 2023 | $ 5,954,258 |
| 2025 | 2024 | 2023 | |
|---|---|---|---|
| Right-of-use asset depreciation expense | $ 1,342,951 | $ 2,070,147 | $ 1,470,877 |
| Interest expense from lease liabilities | 608,819 | 619,526 | 526,986 |
| Expense related to short-term leases | 91,879 | 218,532 | 181,152 |
| Expense related to leases of low value assets | 2,002 | 2,002 | 2,002 |
The Entity has commitments of $1,872,377, $1,688,068 and $1,438,687 and as of December 31, 2025, 2024 and 2023, respectively, for short-term leases; the total cash outflows for these leases are $1,331,507, $1,711,865 and $2,224,880 for 2025, 2024 and 2023, respectively.
11. Lease liabilities
| 2025 | 2024 | 2023 | |
|---|---|---|---|
| Maturity analysis: | |||
| Year 1 | $ 2,211,225 | $ 2,327,171 | $ 1,891,169 |
| Year 2 | 1,643,797 | 1,544,863 | 1,463,353 |
| Year 3 | 1,092,441 | 1,322,347 | 1,074,636 |
| Year 4 | 820,468 | 616,742 | 833,779 |
| Year 5 | 552,085 | 433,465 | 385,146 |
| Subsequent years | 1,817,478 | 2,141,276 | 1,820,084 |
| Less: Unaccrued interest | (2,234,069) | (1,887,870) | (1,738,903) |
| $ 5,903,425 | $ 6,497,994 | $ 5,729,264 | |
| Analyzed as: | |||
| Non-current | $ 4,106,887 | $ 4,326,310 | $ 4,169,837 |
| Current | 1,796,538 | 2,171,684 | 1,559,427 |
| $ 5,903,425 | $ 6,497,994 | $ 5,729,264 | |
12. Financial risk management
The Entity’s Corporate Treasury function offers services to businesses, coordinates access to domestic and international financial markets, supervises and manages the financial risks related to the Entity’s operations through internal risk reports, which analyze risk exposure by level and magnitude. These risks include the market risk (including the exchange rate risk, interest rate risk at fair value and price risk), credit risk, liquidity risk and cash flow interest rate risk.
The Entity is exposed to market, operating and financial risks derived from the use of financial instruments such as interest rate, credit, liquidity and exchange risks, which are managed centrally by the corporate treasury. The Entity seeks to minimize its exposure to these risks by using derivative financial instrument hedges. The use of derivative financial instruments is governed by the Entity’s policies, approved by the Board of Directors, which establish the principles for their contracting. Compliance with these policies and exposure limits is continually reviewed by the internal audit area.
At December 31, 2025, 2024 and 2023, financial instrument classes and amounts are as follows:
| 2025 | 2024 | 2023 | |
|---|---|---|---|
| Financial assets: | |||
| Cash and cash equivalents | $ 23,596,680 | $ 16,241,709 | $ 16,347,047 |
| Measured at amortized cost: | |||
| • Short and long-term accounts receivable | 28,650,212 | 40,713,827 | 36,011,774 |
| • Accounts receivable from related parties | 2,846,677 | 2,570,547 | 6,744,929 |
| Measured at fair value: | |||
| • Derivative financial instruments | 18,175 | 43,490 | 676,244 |
| • Net investment in leased asset | 16,609,795 | 18,963,788 | 15,595,095 |
| Financial liabilities: | |||
| Measured at amortized cost: | |||
| • Loans with financial institutions, other liabilities and long-term debt | $ 36,806,969 | $ 47,657,160 | $ 45,750,302 |
| • Accounts payable to suppliers | 19,141,316 | 21,500,712 | 18,653,841 |
| • Accounts payable to related parties | 2,128,999 | 2,230,078 | 1,540,570 |
| • Other accounts payable | 4,179,520 | 4,520,260 | 3,868,139 |
| • Lease Liabilities | 5,903,425 | 6,497,994 | 5,729,264 |
| Measured at fair value: | |||
| • Derivative financial instruments | 449 | 14,611 | 14,328 |
The Board of Directors establishes and monitors the policies and procedures used to measure risks, which are described below:
- Capital risk management - The Entity manages its capital to ensure that it will continue as a going concern, while maximizing stockholders’ returns by optimizing debt and equity balances. The Entity’s capital structure is composed by its net debt (primarily the bank loans and securitization certificates detailed in Note 20) and stockholders’ equity (issued capital, capital reserves, retained earnings and non-controlling equity detailed in Note 25). The Entity is not subject to any kind of capital requirement.
Leverage level
The leverage level at year-end is as follows:
| 2025 | 2024 | 2023 | |
|---|---|---|---|
| Debt | $ 36,806,969 | $ 47,657,160 | $ 45,750,302 |
| Cash and cash equivalents (including cash and bank balances in a disposal group held for sale) | (23,596,680) | (16,241,709) | (16,347,047) |
| Net debt | $ 13,210,289 | $ 31,415,451 | $ 29,403,255 |
| Net worth | $ 145,380,424 | $ 142,341,968 | $ 128,456,544 |
| Ratio of net debt to net worth | 9.1% | 22.1% | 22.9% |
Debt is defined as long and short-term loans (excluding derivatives and financial collateral contracts), as detailed in note 20.
Net worth includes all the capital and reserves of the Entity which are managed as capital of its controlling interest.
- Interest rate risk management - The Entity is exposed to interest rate risks from customer loans and financial debt contracted at variable rates. The Entity has short-term loans primarily for working capital and, in certain cases, has long-term loans that are intended for projects, the completion of which will enable it to fulfill its obligations. In some cases, depending on the proportion of short-term and long-term debt, interest rate hedges (swap contracts) are contracted. Hedging activities are regularly evaluated to ensure that they are properly aligned with interest rates and the respective risks, and to facilitate the application of more profitable hedge strategies. Hedge contracts are detailed in Note 14.
The Entity’s exposure to interest rate risks is primarily based on the Mexican Interbank Rate (TIIE) applicable to financial liabilities and its customer portfolio. Accordingly, it periodically prepares a sensitivity analysis by considering the net variable interest rate exposure of its customer portfolio and financial liabilities; it also prepares an analysis based on the amount of outstanding credit at the end of the period.
If benchmark interest rates had increased or decreased by 100 basis points in each reporting period and all other variables had remained constant, the pretax profit of 2025, 2024 and 2023 would have increased or decreased by approximately $381,527, $433,508 and $398,564 respectively
-
Exchange risk management -
- The Entity performs transactions denominated in foreign currency; accordingly, it is subject to exposure derived from exchange rate fluctuations. As its functional currency is primarily the Mexican peso, it is exposed to risk resulting from the Mexican peso – US dollar exchange rate, which is utilized for commercial and financing operations. In some cases, these transactions are subject to a natural hedge while, in other cases, these transactions are hedged by contracting currency forwards. Given that the Entity has investments in foreign subsidiaries, the functional currency of which is not a Mexican peso, it is exposed to a foreign currency translation risk. Likewise, monetary assets and liabilities have been contracted in different currencies, essentially the US dollar, Euro and Brazilian real, thus generating exposure to a foreign exchange risk, which is naturally hedged by the same business operations. The carrying values of monetary assets and liabilities denominated in foreign currency and which primarily generate exposure for the Entity at the end of the reporting period, are as follows (figures in thousands)
| Concept | Liabilities | Assets | ||||
|---|---|---|---|---|---|---|
| 2025 | 2024 | 2023 | 2025 | 2024 | 2023 | |
| U.S. dollar (US) | $ 1,077,430 | $ 793,411 | $ 1,140,844 | $ 1,141,796 | $ 1,647,644 | $ 2,198,159 |
| Euro (EU) | 8,581 | 4,884 | 4,099 | 9,559 | 9,876 | 8,626 |
| Brazilian reals (RA) | 254,495 | 153,135 | 168,511 | 292,900 | 243,387 | 287,842 |
| Colombian peso (COL) | 114,479,130 | 111,101,304 | 127,514,392 | 178,431,522 | 146,460,000 | 152,453,081 |
| Peruvian sol (PEN) | 59,534 | 68,917 | 65,580 | 99,248 | 101,911 | 94,332 |
Foreign Currency sensitivity analysis
The following table indicates the Entity’s sensitivity to a 10% increase or decrease of the Mexican peso versus the US dollar and other foreign currencies. This percentage is the sensitivity rate used to internally report the exchange rate risk to key management personnel and also represents management’s evaluation of the possible fair value change of exchange rates. The sensitivity analysis only includes monetary items denominated in foreign currency and adjusts their translation at the end of the period by applying a 10% fluctuation; it also includes external loans. A negative or positive figure, respectively (as detailed in the following table), indicates a (decrease) or increase in net income derived from a decrease in the value of the Mexican peso of 10% with regard to the US dollar (figures in thousands):
| Concept | Stockholders’ equity (1) | Liabilities | Assets | ||||||
|---|---|---|---|---|---|---|---|---|---|
| 2025 | 2024 | 2023 | 2025 | 2024 | 2023 | 2025 | 2024 | 2023 | |
| USD | $ - | $ - | $ - | $ 107,743 | $ 79,341 | $ 114,084 | $ 114,180 | $ 164,764 | $ 219,816 |
| EU | - | 665 | (154) | 858 | 488 | 410 | 956 | 988 | 863 |
| RA | - | - | - | 254,495 | 15,314 | 16,851 | 29,290 | 24,339 | 28,784 |
| COP | - | - | - | 11,447,913 | 11,110,130 | 12,751,739 | 17,843,152 | 14,646,000 | 15,245,308 |
| PEN | - | - | - | 5,953 | 6,892 | 6,558 | 9,925 | 10,191 | 9,433 |
(1) Represents the results of changes to the fair value of derivative instruments designated as cash flow hedges.
- Forwards contracts denominated in foreign currency
The Entity designated certain forwards contracts denominated in foreign currency as cash flow hedges intended for the acquisition of raw materials.
The following table indicates the forwards contracts denominated in foreign currency in effect at the end of the reporting period:
| Cash flow hedges | Average exchange rate | Notional value | Fair value | ||||||
|---|---|---|---|---|---|---|---|---|---|
| 2025 | 2024 | 2023 | 2025 | 2024 | 2023 | 2025 | 2024 | 2023 | |
| Euro purchase More than 12 months | $ 21.6805 | $ 19.7959 | $ 19.2099 | $ - | $ 8,050 | $ 4,200 | $ - | $ (9,501) | $ 2,195 |
| Dollar purchase More than 12 months | $ 19.2245 | $ 18.3001 | $ 17.7657 | $ - | $ - | $ 94,090 | $ - | $ - | $ (13,542) |
- Credit risk management
Note 6 details the Entity’s maximum credit risk exposure and the measurement bases used to determine expected credit losses.
Credit risk refers to the risk that one of the parties will default on its contractual obligations, thus resulting in a financial loss for the Entity, which essentially arises from accounts receivable with customers and liquid funds. The credit risk related to cash and cash equivalents and derivative financial instruments is limited because counterparties are banks with high credit ratings assigned by credit rating agencies. The maximum credit risk exposure is represented by the Entity’s balance in accounting. The other credit risk exposure is represented by the balance of each financial asset, mainly with regard to commercial receivables. The Entity sells its products and/or services to customers who have demonstrated their economic solvency. It periodically evaluates its customers’ financial conditions and maintains collection insurance contracts for domestic and export sales. Accordingly, the Entity does not consider that there is a significant risk of loss from a concentration of credit in its commercial sector customer base, which is composed by 2,015,851 customers that do not represent a concentration risk in the individual, industrial and infrastructure and construction sectors, although the of credit concentration risk is higher. - Liquidity risk management - The Entity’s Corporate Treasury is ultimately responsible for liquidity management and has established appropriate policies to control this aspect by monitoring working capital, managing short, medium and long-term funding requirements, maintaining cash reserves and available credit lines, continuously monitoring cash flows (projected and actual) and reconciling the maturity profiles of financial assets and liabilities.
The following table details the remaining contractual maturities of the Entity’s non-derivative financial liabilities, based on contractual repayment periods. Contractual maturities are based on the dates on which the Entity must make each payment.
The amounts contained in the debt with credit institutions include the fixed and variable interest rate instruments detailed in Note 20. If changes in variable interest rates differ from the estimated interest rates determined at the end of the reporting period, they are presented at fair value. The Entity expects to meet its obligations with cash flows from operations and resources received from the maturity of financial assets.
| As of December 31, 2025 | Weighted average effective interest rate | 1 year | Between 1 and 3 years | More than 3 years | Total |
|---|---|---|---|---|---|
| Loans with financial institutions and other entities | MX 7.00% USD 5.67% | $ 15,393,110 | $ 6,959,489 | $ 14,454,370 | $ 36,806,969 |
| Accounts payable to suppliers | 19,141,316 | - | - | 19,141,316 | |
| Accounts payable to related parties | 2,128,999 | - | - | 2,128,999 | |
| Other accounts payable and accrued liabilities | 4,179,520 | - | - | 4,179,520 | |
| Lease liabilities | 2,211,225 | 2,736,238 | 3,190,031 | 8,137,494 | |
| Derivative financial instruments | 449 | - | - | 449 | |
| Total | $ 43,054,619 | $ 9,695,727 | $ 17,644,401 | $ 70,394,747 |
| As of December 31, 2024 | Weighted average effective interest rate | 1 year | Between 1 and 3 years | More than 3 years | Total |
|---|---|---|---|---|---|
| Loans with financial institutions and other entities | MX 12.00 % USD 6.00 % | $ 12,375,635 | $ 17,243,556 | $ 18,037,969 | $ 47,657,160 |
| Accounts payable to suppliers | 21,500,712 | - | - | 21,500,712 | |
| Accounts payable to related parties | 2,244,256 | - | - | 2,244,256 | |
| Other accounts payable and accrued liabilities | 4,520,260 | - | - | 4,520,260 | |
| Lease liabilities | 2,327,171 | 2,867,210 | 3,191,483 | 8,385,864 | |
| Derivative financial instruments | 14,611 | - | - | 14,611 | |
| Total | $ 42,982,645 | $ 20,110,766 | $ 21,229,452 | $ 84,322,863 |
| As of December 31, 2023 | Weighted average effective interest rate | 1 year | Between 1 and 3 years | More than 3 years | Total |
|---|---|---|---|---|---|
| Loans with financial institutions and other entities | MX 12.29% USD 5.35% | $ 19,097,178 | $ 15,053,969 | $ 11,599,155 | $ 45,750,302 |
| Accounts payable to suppliers | 18,653,841 | - | - | 18,653,841 | |
| Accounts payable to related parties | 1,540,570 | - | - | 1,540,570 | |
| Other accounts payable and accrued liabilities | 3,868,139 | - | - | 3,868,139 | |
| Lease liabilities | 1,891,169 | 2,537,989 | 3,039,009 | 7,468,167 | |
| Derivative financial instruments | 786 | 13,542 | - | 14,328 | |
| Total | $ 45,051,683 | $ 17,605,500 | $ 14,638,164 | $ 77,295,347 |
- Commodities risk - The Entity has executed commodities contracts to cover risks derived from the price fluctuations of certain metals.
Market risk exposure is measured by performing a sensitivity analysis. There have been no changes in market risk exposure or the manner in which those risks are being managed and measured
13. Financial instruments
The following table combines information about:
- Classes of financial instruments based on their nature and characteristics;
- The carrying amounts of financial instruments;
- Fair values of financial instruments (except in the case of financial instruments when their book value approaches their fair value); and
- Levels of fair value hierarchy of financial assets and financial liabilities for which fair value was disclosed.
Fair value hierarchy levels 1 to 3 are based on the degree to which fair value is observable:
- Level 1 fair value measurements are those derived from the prices listed (unadjusted) on active markets for identical assets or liabilities;
- Level 2 fair value measurements are those derived from inputs other than the listed prices included in Level 1 that are observable for the asset or liability, either directly (i.e., as prices) or indirectly (i.e., price derivatives); and
- Level 3 fair value measurements are those derived from valuation techniques that include inputs for the asset or liability that are not based on observable market data (unobservable inputs).
- Fair value of the Entity’s financial assets and financial liabilities that are measured at fair value on a recurring basis
Some of the Entity’s financial assets and financial liabilities are measured at fair value at the end of each reporting period. The following table provides information on the manner in which the fair values of these financial assets and financial liabilities are determined (more specifically, the valuation techniques and inputs used).
| Financial assets/financial liabilities | Fair value | Fair value hierarchy | Valuation techniques and key inputs | Significant unobservable input(s) | Relationship of unobservable inputs to fair value | ||
|---|---|---|---|---|---|---|---|
| 31/12/25 | 31/12/24 | 31/12/23 | |||||
| 1) Foreign currency forward contracts (see Note 14) (i) | - | Liabilities $ (9,501) | Liabilities $ (11,347) | Level 2 | Discounted cash flows. Future cash flows are estimated based on forward exchange rates (according to observable forward exchange rates at the end of the reporting period) and contract forward rates, discounted at a rate that reflects the credit risk of various counterparties. | N/A | N/A |
| 2) Interest rate swaps, copper and aluminum purchases (see Note 14) (i) | Assets $17,726 | Assets $ 38,380 | Assets $ 673,263 | Level 2 | Discounted cash flows. | N/A | N/A |
(i) Represents financial instruments that, following their initial recognition, are measured at fair value and grouped into levels ranging from 1 to 3 to the extent that their fair value is observed, whereby the Level 2 instruments derived from indicators other than listed prices, but which include observable indicators for the asset or liability, whether directly or indirectly resulting from these listed prices. During the years ended December 31, 2025, 2024 and 2023, there were no transfers between levels and all three years were classified as Level 2.
- Fair value of financial assets and financial liabilities that are not measured at fair value on a recurring basis
The fair value of the financial instruments presented below has been determined by the Entity using available market information or other valuation techniques that require judgment to develop and interpret fair value estimates. It also utilizes assumptions based on existing market conditions at each of the dates of the statement of changes in financial position. Consequently, the estimated amounts presented are not necessarily indicative of the amounts the Entity could realize in a current market transaction. The use of different assumptions and/or estimation methods may have a material effect on estimated fair value amounts.
The amounts of the Entity’s cash and cash equivalents, as well as its accounts receivable and payable to third parties and related parties, the current portion of the long-term debt and loans from financial institutions and long-term debt approximate their fair value because they have short-term maturities. The Entity’s long-term debt is recorded at applied cost and includes debt that accrues fixed and variable interest according to market indicators.
Listed market prices or quotations provided by operators for similar instruments are used to obtain and disclose the fair value of long-term debt. In order to determine the fair value of other financial instruments, techniques like estimated cash flows are used, while considering cash flow dates in intertemporal market curves and discounting these cash flows by using rates that reflect the counterparty risk and the Entity’s risk during the reference period.
The fair value of interest rate swaps is calculated as the present value of future estimated net cash flows. The fair value of currency futures is determined using listed forward exchange rates at the date of the statement of changes in financial position.
The carrying amounts of financial instruments by class and their estimated fair values are as follows:
| December 31, 2025 | December 31, 2024 | December 31, 2023 | ||||
|---|---|---|---|---|---|---|
| Carrying amounts | Fair value | Carrying amounts | Fair value | Carrying amounts | Fair value | |
| Financial assets: | ||||||
| Cash and cash equivalents | $ 23,596,680 | $ 23,596,680 | $ 16,241,709 | $ 16,241,709 | $ 16,347,047 | $ 16,347,047 |
| Accounts and loans receivable: | ||||||
| Short and long-term accounts receivable | 59,313,786 | 59,975,710 | 80,664,192 | 81,382,389 | 63,814,957 | 69,018,465 |
| Accounts receivable with related parties | 2,846,677 | 2,846,677 | 2,570,547 | 2,570,547 | 6,744,929 | 6,744,929 |
| Accounts and notes payable: | ||||||
| Short and long-term loans payable to financial institutions including long-term and other debt | (20,106,969) | (20,160,398) | (26,957,160) | (27,022,431) | (31,050,302) | (31,628,099) |
| Securitization certificates | (16,700,000) | (17,151,614) | (20,700,000) | (20,927,954) | (14,700,000) | (15,179,102) |
| Accounts payable to suppliers | (19,141,316) | (19,141,316) | (21,500,712) | (21,500,712) | (18,653,841) | (18,653,841) |
| Accounts payable to related parties | (2,128,999) | (2,128,999) | (2,230,078) | (2,230,078) | (1,540,570) | (1,540,570) |
| Lease liabilities | (5,903,425) | (7,642,328) | (6,497,994) | (8,385,864) | (5,729,264) | (7,468,167) |
| Other accounts payable | (4,179,520) | (4,179,520) | (4,520,260) | (4,520,260) | (3,868,139) | (3,868,139) |
| $ 17,596,914 | $ 16,014,892 | $ 17,070,244 | $ 15,607,346 | $ 11,364,817 | $ 13,772,523 | |
The fair values shown at December 31, 2025, 2024 and 2023, except for accounts receivable involving commercial sector customers and securitization certificates, do not differ from the respective carrying amounts because the observed market values are similar to those recorded in these periods.
14. Derivative financial instruments
The purpose of contracting derivative financial instruments is: (i) to partially hedge the exposure to financial risks due to exchange rates, interest rates and prices of certain metals; or (ii) the expectation of a good financial return derived from the behavior of the underlying. The decision to contract an economic or financial hedge is based on current market conditions, the expectation of market conditions at a given date, and the domestic and international economic context of the economic indicators that influence the Entity’s operations.
Transactions involving currency and interest rate forwards and swaps are summarized below:
| Instrumento | Designated as | Notional | Maturity | Valuation as of December 31, 2025 | ||||
|---|---|---|---|---|---|---|---|---|
| Amount (‘000) | Unit | Asset (liability) | Financial cost of the year | Financial cost of prior years | (Gain) loss on settlement | |||
| Swaps TIIE to fixed (as of the end of December 2025, it no longer has this type of instrument) | ||||||||
| Total at December 31, 2025 | $ - | $ - | $ - | $ - | ||||
| Total at December 31, 2024 | $ - | $ 143,516 | $ (143,519) | $ (169,681) | ||||
| Total at December 31, 2023 | $ 143,519 | $ 145,632 | $ (289,151) | $ (223,546) | ||||
Open and settled transactions involving currency hedge forwards are summarized below:
| Instrumento | Designated as | Notional | Valuation as of December 31 | ||||
|---|---|---|---|---|---|---|---|
| Amount (‘000) | Unit | Maturity | Asset (liability) | Comprehensive income | (Gain) loss on settlement Cost of sales | ||
| Dollar forwards purchase | |||||||
| Dollar forwards purchase | |||||||
| Euro forwards purchase | |||||||
| Euro forwards sale | |||||||
| Total at December 31, 2025 | $ - | $ - | $ - | ||||
| Total at December 31, 2024 | $ - | $ 143,516 | $ (143,519) | ||||
| Total at December 31, 2023 | $ 143,519 | $ 145,632 | $ (289,151) | ||||
Transactions involving interest rate swaps are summarized below:
| Instrumento | Notional | Valuation as of December 31 | ||||
|---|---|---|---|---|---|---|
| Amount (‘000) | Unit | Maturity | Asset (liability) | Comprehensive income | (Gain) loss on settlement Cost of sales | |
| TIIE to fixed swaps | 674,749 | Pesos | September 2029 | $ 6,473 | $ (4,531) | $ 15,254 |
| Total at December 31, 2025 | $ 6,473 | $ (4,531) | $ 15,254 | |||
| Total at December 31, 2024 | $ 43,210 | $ (30,247) | $ (657,372) | |||
| Total at December 31, 2023 | $ 527,136 | $ (368,995) | $ (102,001) | |||
The open and settled transactions involving metal hedge swaps are summarized below:
| Instrumento | Notional | Valuation as of December 31 | ||||
|---|---|---|---|---|---|---|
| Amount (‘000) | Unit | Maturity | Asset (liability) | Comprehensive income | (Gain) loss on settlement Cost of sales | |
| Copper swaps purchase | 633 | Tons | September 2026 | $ 10,641 | $ (7,448) | $ 12,677 |
| Copper swaps purchase | 836 | Tons | During 2025 | - | - | (6,659) |
| Zinc Swaps purchase | 100 | Tons | January to February 2026 | 436 | (305) | 449 |
| Nickel Swaps purchase | 7 | Tons | September 2026 | 228 | (160) | 109 |
| Aluminum Swaps purchase | 25 | Tons | August 2026 | (52) | 36 | - |
| Aluminum Swaps purchase | 8,843 | Tons | During 2025 | - | - | (5,210) |
| Oil Swaps (Purchase) | 630,000 | Barrels | During 2025 | - | - | (29,685) |
| Total at December 31, 2025 | $ 11,253 | $ (78,779) | $ (28,319) | |||
| Total at December 31, 2024 | $ (4,830) | $ 3,381 | $ (4,004) | |||
| Total at December 31, 2023 | $ 2,608 | $ (2,377) | $ 5,364 | |||
15. Property, plant and equipment
The reconciliation carrying amounts at the start and end of 2025, 2024 and 2023 is as follows:
| Balances as of December 31, 2024 | Additions | Business acquisition | Retirements / disposals | Transfers | Exchange differences on translation | Balances as of December 31, 2025 | |
|---|---|---|---|---|---|---|---|
| Investment: | |||||||
| Land | $ 6,740,550 | $ 36,532 | $ - | $ (1,073,446) | $ (232,751) | $ (99,905) | $ 5,370,980 |
| Mineral resources | 2,576,111 | - | - | - | - | (189,887) | 2,386,224 |
| Buildings and constructions | 40,081,506 | 190,909 | - | (607,353) | (707,504) | (1,890,799) | 37,066,759 |
| Machinery and equipment | 53,593,696 | 948,324 | - | (462,964) | 1,477,669 | 25,274 | 55,581,999 |
| Tangible assets for exploration and evaluation | 11,854,049 | - | - | - | 2,004,590 | 16,176 | 13,874,815 |
| Furniture and fixtures | 7,687,906 | 261,358 | - | (53,066) | 4,457 | (13,437) | 7,887,218 |
| Computer equipment | 2,738,274 | 118,543 | - | (45,988) | 52,745 | (22,669) | 2,840,905 |
| Vehicles | 2,288,983 | 99,970 | - | (177,452) | 46,070 | (11,968) | 2,245,603 |
| Construction in process | 10,444,339 | 6,554,557 | - | (47,005) | - | (601,214) | 12,588,268 |
| Total investment | 138,005,414 | 8,210,193 | - | (2,467,274) | (1,117,133) | (2,788,429) | 139,842,771 |
| Accumulated depreciation: | |||||||
| Mineral resources | (204,216) | (11,437) | - | - | - | 12,831 | (202,822) |
| Buildings and constructions | (18,553,543) | (1,105,489) | - | 181,704 | 668,763 | 686,050 | (18,122,515) |
| Machinery and equipment | (33,006,420) | (2,709,187) | - | 476,923 | 45,935 | 500,668 | (34,692,081) |
| Tangible assets for exploration and evaluation | (3,415,086) | (851,841) | - | - | - | 405,703 | (3,861,224) |
| Furniture and fixtures | (6,043,011) | (344,554) | - | 65,112 | (1,227) | 5,304 | (6,318,376) |
| Computer equipment | (2,356,386) | (126,582) | - | 31,846 | 3,121 | 10,088 | (2,437,913) |
| Vehicles | (1,174,676) | (238,334) | - | 96,767 | 337 | 3,251 | (1,312,655) |
| Total accumulated depreciation | (64,753,338) | (5,387,424) | - | 852,352 | 716,929 | 1,623,895 | (66,947,586) |
| Impairment: | |||||||
| Land | (16,497) | - | - | - | - | - | (16,497) |
| Buildings and constructions | (185,440) | (4,152) | - | - | - | - | (189,592) |
| Machinery and equipment | (742,332) | (396,456) | - | 14,856 | - | 34,250 | (1,089,682) |
| Furniture and fixtures | (65,070) | 11,856 | - | - | - | - | (53,214) |
| Computer equipment | (13,707) | 252 | - | - | - | - | (13,455) |
| Vehicles | (496) | - | - | - | - | - | (496) |
| Accumulated impairment losses | (1,023,542) | (388,500) | - | 14,856 | - | 34,250 | (1,362,936) |
| Net investment | $ 72,228,534 | $ 2,434,269 | $ - | $ (1,600,066) | $ (400,204) | $ (1,130,284) | $ 71,532,249 |
| Balances as of December 31, 2023 | Additions | Business acquisition | Retirements / disposals | Transfers | Exchange differences on translation | Balances as of December 31, 2024 | |
|---|---|---|---|---|---|---|---|
| Investment: | |||||||
| Land | $ 6,548,469 | $ 56,467 | $ - | $ - | $ (83,129) | $ 218,743 | $ 6,740,550 |
| Mineral resources | 2,736,087 | - | - | - | (525,983) | 366,007 | 2,576,111 |
| Buildings and constructions | 38,474,527 | 419,004 | - | (185,373) | (1,850,228) | 3,223,576 | 40,081,506 |
| Machinery and equipment | 52,709,052 | 623,189 | - | (512,962) | (1,758,739) | 2,533,156 | 53,593,696 |
| Tangible assets for exploration and evaluation | 0 | 1,343,727 | 11,246,515 | - | - | (736,193) | 11,854,049 |
| Furniture and fixtures | 7,253,723 | 445,149 | - | (28,625) | (1,922) | 19,581 | 7,687,906 |
| Computer equipment | 2,650,850 | 128,680 | - | (98,019) | 28,857 | 27,906 | 2,738,274 |
| Vehicles | 2,251,428 | 179,407 | - | (117,879) | (56,054) | 32,081 | 2,288,983 |
| Construction in process | 7,210,931 | 3,280,385 | 742,278 | (135,414) | (3,637,977) | 2,984,136 | 10,444,339 |
| Total investment | 119,835,067 | 6,476,008 | 11,988,793 | (1,078,272) | (7,885,175) | 8,668,993 | 138,005,414 |
| Accumulated depreciation: | |||||||
| Mineral resources | (256,543) | (11,898) | - | (1,018) | 100,626 | (35,383) | (204,216) |
| Buildings and constructions | (17,229,188) | (1,063,897) | - | 69,732 | 794,816 | (1,125,006) | (18,553,543) |
| Machinery and equipment | (31,822,651) | (2,208,662) | - | 185,500 | 1,829,995 | (990,602) | (33,006,420) |
| Tangible assets for exploration and evaluation | - | (500,650) | (2,482,015) | - | - | (432,421) | (3,415,086) |
| Furniture and fixtures | (5,725,506) | (334,620) | - | 26,139 | 5,560 | (14,584) | (6,043,011) |
| Computer equipment | (2,301,210) | (136,452) | - | 95,005 | 15,061 | (28,790) | (2,356,386) |
| Vehicles | (1,167,576) | (228,101) | - | 92,210 | 165,486 | (36,695) | (1,174,676) |
| Total accumulated depreciation | (58,502,674) | (4,484,280) | (2,482,015) | 467,568 | 2,911,544 | (2,663,481) | (64,753,338) |
| Impairment: | |||||||
| Land | (16,497) | - | - | - | - | - | (16,497) |
| Buildings and constructions | (250,393) | 13,836 | - | - | - | 51,117 | (185,440) |
| Machinery and equipment | (1,654,861) | (181) | - | 11,027 | 1,213,963 | (312,280) | (742,332) |
| Furniture and fixtures | (72,105) | 7,034 | - | - | - | 1 | (65,070) |
| Computer equipment | (13,740) | 44 | - | - | 40 | (51) | (13,707) |
| Vehicles | (496) | - | - | - | - | - | (496) |
| Accumulated impairment losses | (2,008,092) | 20,733 | - | 11,027 | 1,214,003 | (261,213) | (1,023,542) |
| Net investment | $ 59,324,301 | $ 2,012,461 | $ 9,506,778 | $ (599,677) | $ (3,759,628) | $ 5,744,299 | $ 72,228,534 |
| Balances as of December 31, 2022 | Additions | Business acquisition | Retirements / disposals | Transfers | Exchange differences on translation | Balances as of December 31, 2023 | |
|---|---|---|---|---|---|---|---|
| Investment: | |||||||
| Land | $ 6,654,631 | $ - | $ - | $ (20,113) | $ 14,802 | $ (100,851) | $ 6,548,469 |
| Mineral resources | 3,003,749 | - | - | - | - | (267,662) | 2,736,087 |
| Buildings and constructions | 40,201,730 | 501,319 | - | (104,516) | 146,471 | (2,270,477) | 38,474,527 |
| Machinery and equipment | 53,086,615 | 253,980 | - | (558,979) | 1,187,841 | (1,260,405) | 52,709,052 |
| Furniture and fixtures | 7,030,179 | 323,903 | - | (100,979) | (1,743) | 2,363 | 7,253,723 |
| Computer equipment | 2,611,152 | 72,945 | - | (48,016) | 34,924 | (20,155) | 2,650,850 |
| Vehicles | 1,722,253 | 147,226 | - | (168,809) | 580,248 | (29,490) | 2,251,428 |
| Construction in process | 5,310,724 | 4,251,413 | - | (92,682) | (2,020,000) | (238,524) | 7,210,931 |
| Total investment | 119,621,033 | 5,550,786 | - | (1,094,094) | (57,457) | (4,185,201) | 119,835,067 |
| Accumulated depreciation: | |||||||
| Mineral resources | (271,791) | (9,509) | - | (847) | - | 25,604 | (256,543) |
| Buildings and constructions | (16,899,358) | (1,042,530) | - | 233,189 | 13,708 | 465,803 | (17,229,188) |
| Machinery and equipment | (31,367,178) | (2,038,060) | - | 194,889 | 549,218 | 838,480 | (31,822,651) |
| Furniture and fixtures | (5,517,249) | (310,826) | - | 98,076 | 3,927 | 566 | (5,725,506) |
| Computer equipment | (2,252,086) | (109,944) | - | 42,944 | 5,953 | 11,923 | (2,301,210) |
| Vehicles | (1,084,913) | (181,806) | - | 76,730 | 5,687 | 16,726 | (1,167,576) |
| Total accumulated depreciation | (57,392,575) | (3,692,675) | - | 644,981 | 578,493 | 1,359,102 | (58,502,674) |
| Impairment: | |||||||
| Land | (16,497) | - | - | - | - | - | (16,497) |
| Buildings and constructions | (148,666) | (101,727) | - | - | - | - | (250,393) |
| Machinery and equipment | (457,316) | (6,490) | - | (549,116) | (439,464) | (202,475) | (1,654,861) |
| Furniture and fixtures | (63,038) | (9,067) | - | - | - | - | (72,105) |
| Computer equipment | (13,650) | (77) | - | - | (13) | - | (13,740) |
| Vehicles | (496) | - | - | - | - | - | (496) |
| Accumulated impairment losses | (699,663) | (117,361) | - | (549,116) | (439,477) | (202,475) | (2,008,092) |
| Net investment | $ 61,528,795 | $ 1,740,750 | $ - | $ (998,229) | $ 81,559 | $ (3,028,574) | $ 59,324,301 |
Total transfers to investment properties during 2025, 2024 and 2023 were $1,585,836, $56,159 and $22,235, respectively
(1) As of December 31, 2024 and 2023, the Projects in process category includes 2 platforms named El Centenario and La Muralla IV (which will be called Independencia II and Independencia III).
16. Investment properties
| Concept | 2025 | 2024 | 2023 |
|---|---|---|---|
| Investment properties | $ 7,886,716 | $ 5,143,649 | $ 4,958,956 |
Investment property movements:
| Concept | 2025 | 2024 | 2023 |
|---|---|---|---|
| Balance at the start of the year | $ 5,143,649 | $ 4,958,956 | $ 4,766,120 |
| Additions | - | - | - |
| Transfers | 1,505,836 | (56,139) | 22,235 |
| Fair value adjustments applied to investment properties | 1,237,231 | 240,832 | 170,601 |
| Balance at the end of the period | $ 7,886,716 | $ 5,143,649 | $ 4,958,956 |
Grupo Carso fully owns all its investment properties.
Grupo Carso uses valuations performed by independent expert appraisers the necessary qualifications and relevant experience as regards the locations and categories of the investment properties it maintains.
Valuation is based on different techniques with the following approaches:
Through its subsidiaries, the Entity has two shopping malls, Loreto and Plaza Inbursa, located in Mexico City, which generate rental income that is recognized in results as rentals are accrued, for the amounts of $218,032, $210,118 and $196,905 for the years ended December 31, 2025, 2024 and 2023, respectively. At December 31, 2025, 2024 and 2023, the occupancy rate of shopping centers is of 76%, 77% and 71%, respectively.
Direct operating expenses including maintenance costs incurred for the investment properties are recognized in results and represent approximately 50%, 48% and 55% of rental income for years ended December 31, 2025, 2024 and 2023, respectively.
When estimating the fair value of its real property, the Entity considered highest and best use of its properties is their current use.
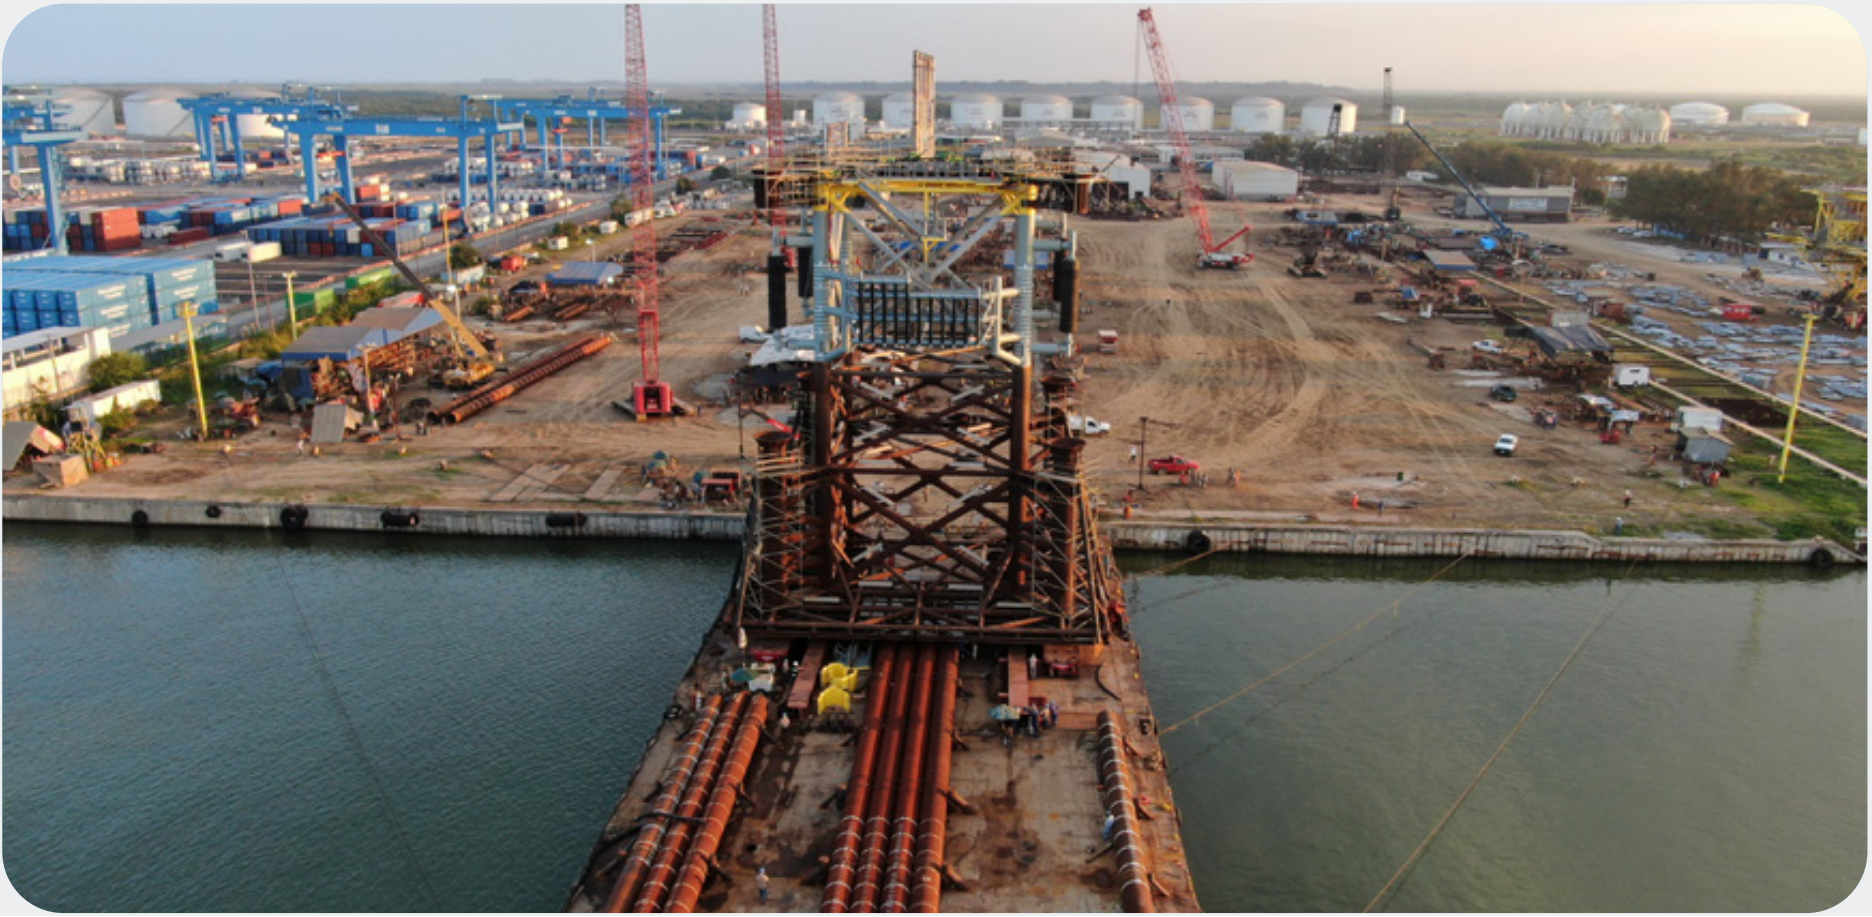
Details of the Entity investment properties and information regarding the fair value hierarchy as of December 31, 2025, 2024 and 2023 are as follows:
| 2025 | 2024 | 2023 | ||||
|---|---|---|---|---|---|---|
| Level 3 | Total fair value | Level 3 | Total fair value | Level 3 | Total fair value | |
| Shopping malls located in Mexico City | $ 4,969,634 | $ 4,969,634 | $ 2,520,631 | $ 2,520,631 | $ 2,519,550 | $ 2,519,550 |
| Land located in Baja California and other areas (1) | 1,689,561 | 1,689,561 | 1,593,742 | 1,593,742 | 1,622,051 | 1,622,051 |
| Land and buildings | 1,227,521 | 1,227,521 | 1,029,276 | 1,029,276 | 817,355 | 817,355 |
| Total | $ 7,886,716 | $ 7,886,716 | $ 5,143,649 | $ 5,143,649 | $ 4,958,956 | $ 4,958,956 |
(1) Investment properties are composed by land located in Baja California, land and industrial buildings in the State of Mexico, Querétaro and Guanajuato.
The following information is relevant for investment properties classified as Level 3 of the fair value hierarchy:
| Valuation technique(s) | Significant unobservable input(s) | Sensitivity | |
|---|---|---|---|
| Commercial units located in Mexico City | Comparable sales approach in 2025, 2024 and 2023 | As of December 31, 2025, 2024 and 2023, fair value was determined on the basis of the comparable sales approach, which reflects the sales of a similar asset adjusted for the characteristics of the asset. Monthly rent considering differences in locations and individual factors such as frontage and size, between properties comparable to an average. | A slight increase in materials prices would result in a significant fair value increase and vice versa. A slight increase in the capitalization rate used would result in a significant fair value decrease, and vice versa. A significant lease market increase would result in a significant fair value increase and vice versa. |
| Land | Market approach | No appraisals have been performed during the last 3 years because market conditions have not changed and are not expected to change in the following periods. |
17. Investment in associated entities and joint ventures and other
- The main associated entities, businesses, other joint ventures and their priority activities are as follows:
| Associated entity and joint venture | Equity percentage | Location | Activity | ||
|---|---|---|---|---|---|
| 2025 | 2024 | 2023 | |||
| Talos Energy México 7, S. de R. L. de C. V. | 49.90 | 49.90 | 49.90 | Mexico | Exploration, drilling, and extraction of hydrocarbons. |
| Inmuebles SROM, S. A. de C. V. | 15.00 | 14.00 | 14.00 | Mexico | Leasing of real estate |
| Miniso BF Holding S. R. L. de C. V. | 33.27 | 33.27 | 33.27 | Mexico | Operation of multi-category low-cost product stores under specialized franchise models. |
| Aerofrisco, S. A. de C. V. | 16.35 | 18.21 | 18.21 | Mexico | Air transportation of cargo and passengers. |
| Infraestructura y Saneamiento Atotonilco, S. A. de C. V. (joint venture) | 42.50 | 42.50 | 42.50 | Mexico | Construction of wastewater treatment plant. |
| Constructora MT de Oaxaca, S. A. de C. V. (joint venture) | 40.00 | 40.00 | 40.00 | Mexico | Road construction. |
| Trans-Pecos Pipeline, LLC (joint venture) | 51.00 | 51.00 | 51.00 | United States | Natural gas transportation via pipelines. |
| Comanche Trail Pipeline, LLC (joint venture) | 51.00 | 51.00 | 51.00 | United States | Natural gas transportation via pipelines. |
| GMéxico Transportes, S. A. B. de C. V. | 15.14 | 15.14 | 15.14 | Mexico | Railway transportation. |
| Grupo Cuprum, S. A. P. I. de C. V. (Cuprum) | 7.50 | 7.50 | 7.50 | Mexico | Manufacturing of aluminum products. |
- The recognition of the equity method for the main associated entities, joint ventures and other entities was as follows:

| Stockholders’ equity | Net income | Equity percentage | Investment in shares | Equity in income | |
|---|---|---|---|---|---|
| Talos Energy México 7, S. de R. L. de C. V. (5) | $ 1,217,494 | $ (89,870) | 49.90 | $ 2,134,386 | $ (40,930) |
| Inmuebles SROM, S. A. de C. V. | 16,372,592 | 1,062,392 | 15.00 | 2,455,889 | 152,798 |
| Miniso BF Holding, S. de R. L. de C. V. | 2,048,300 | 1,082,200 | 33.27 | 1,389,108 | 349,825 |
| Aerofrisco, S. A. de C. V. (4) | 2,681,975 | (92,663) | 16.35 | 438,505 | (15,151) |
| Infraestructura y Saneamiento Atotonilco, S. A. de C. V. | (156,278) | (4,593) | 42.50 | (66,418) | (1,952) |
| Constructora MT de Oaxaca, S. A. de C. V. | (166,250) | 10,668 | 40.00 | (66,500) | 4,267 |
| Trans-Pecos Pipeline, LLC. (2) | 8,592,061 | 965,427 | 51.00000 | 4,381,951 | 492,368 |
| Comanche Trail Pipeline, LLC. (3) | 6,656,915 | 966,195 | 51.00000 | 3,395,027 | 492,759 |
| Other associated entities | 578,396 | 29,012 | |||
| Total investment in associated entities | 14,640,344 | 1,462,996 | |||
| Other investments | 3,605 | - | |||
| Total investment in associated entities | 14,643,949 | 1,462,996 | |||
| Entities at market value | |||||
| GMéxico Transportes, S. A. B. de C.V. | 15.14 | 23,162,539 | - | ||
| Cuprum (1) | 7.5 | 531,552 | - | ||
| 23,694,091 | - | ||||
| Total investment in associated entities, joint ventures and other entities | $ 38,338,040 | $ 1,462,996 | |||
| Stockholders’ equity | Net income | Equity percentage | Investment in shares | Equity in income | |
|---|---|---|---|---|---|
| Talos Energy México 7, S. de R. L. de C. V. (5) | $ 1,336,192 | (197,840) | 49.90 | $ 2,281,810 | $ (112,304) |
| Inmuebles SROM, S. A. de C. V. | 15,255,265 | 144,764 | 14.00 | 2,135,736 | 144,764 |
| Miniso BF Holding, S. de R. L. de C. V. | 1,625,291 | 962,910 | 33.27 | 1,300,396 | 336,012 |
| Aerofrisco, S. A. de C. V. (4) | 2,556,310 | (11,496) | 18.21 | 465,547 | (2,094) |
| Infraestructura y Saneamiento Atotonilco, S. A. de C. V. | (151,685) | (17,567) | 42.50 | (64,466) | (7,466) |
| Constructora MT de Oaxaca, S. A. de C. V. | (176,918) | (5,148) | 40.00 | (70,767) | (2,059) |
| Trans-Pecos Pipeline, LLC. (2) | 9,799,502 | 988,131 | 51.00 | 4,997,746 | 503,947 |
| Comanche Trail Pipeline, LLC. (3) | 7,353,053 | 759,792 | 51.00 | 3,750,057 | 387,494 |
| Other associated entities | 501,874 | 59,404 | |||
| Total investment in associated entities | 15,297,933 | 1,307,698 | |||
| Other investments | 4,791 | - | |||
| Total investment in associated entities | 15,302,724 | 1,307,698 | |||
| Entities at market value | |||||
| GMéxico Transportes, S. A. B. de C.V. | 15.14 | 21,684,079 | - | ||
| Cuprum (1) | 7.50 | 528,760 | - | ||
| 22,212,839 | - | ||||
| Total investment in associated entities, joint ventures and other entities | $ 37,515,563 | $ 1,307,698 | |||
| Stockholders’ equity | Net income | Equity percentage | Investment in shares | Equity in income | |
|---|---|---|---|---|---|
| Talos Energy México 7, S. de R. L. de C. V. | $ 1,179,054 | 7,563 | 49.90 | $ 2,165,941 | $ 3,774 |
| Inmuebles SROM, S. A. de C. V. | 14,221,243 | 746,119 | 14.00 | 1,990,974 | 104,456 |
| Miniso BF Holding, S. de R. L. de C. V. | 739,075 | 813,670 | 33.27 | 1,005,532 | 271,676 |
| Aerofrisco, S. A. de C. V. | 2,567,806 | (159,551) | 18.21 | 467,641 | (29,057) |
| Infraestructura y Saneamiento Atotonilco, S. A. de C. V. | (134,118) | 5,471 | 42.50 | (57,000) | 2,325 |
| Constructora MT de Oaxaca, S. A. de C. V. | (171,770) | 10,658 | 40.00 | (68,708) | 4,263 |
| Trans-Pecos Pipeline, LLC. | 7,879,794 | 799,618 | 51.00 | 4,018,695 | 407,805 |
| Comanche Trail Pipeline, LLC. | 5,706,018 | 851,314 | 51.00 | 2,910,069 | 434,170 |
| Other associated entities | 271,860 | 68,296 | |||
| Total investment in associated entities | 12,705,004 | 1,267,708 | |||
| Other investments | 4,385 | - | |||
| Total investment in associated entities | 12,709,389 | 1,267,708 | |||
| Entities at market value | |||||
| GMéxico Transportes, S. A. B. de C.V. | 15.14 | 25,440,166 | - | ||
| Cuprum | 7.50 | 531,165 | - | ||
| 25,971,331 | - | ||||
| Total investment in associated entities, joint ventures and other entities | $ 38,680,720 | $ 1,267,708 | |||
(1) The investment in Cuprum shares includes goodwill amounting to $45,092
(2) As of December 31, 2025, 2024 and 2023, the stock investment includes a dividend payment of $430,092 and a profit of $905,196, dividends of $262,026 and a profit of $669,798, dividends of $283,617 and a profit of $428,961, respectively, which are recognized as other comprehensive results in the consolidated income statement.
(3) As of December 31, 2025, 2024 and 2023, the stock investment includes a dividend payment of $157,172 and a profit of $609,678, dividends of $157,132 and a profit of $462,206, dividends of $163,768 and a profit of 408,972, respectively, which are recognized as other comprehensive results in the consolidated income statement.
(4) The investment in Aerofrisco shares includes goodwill amounting to $86,783.
(5) The investment in Talos Energy Mexico 7 shares includes goodwill amounting to $1,494,932.
18. Other assets
Other assets are composed as follows:
| Concept | Notes | 2025 | 2024 | 2023 |
|---|---|---|---|---|
| Insurance and bonds | (a) | $ 781,804 | $ 781,804 | $ 781,804 |
| Collaborative commission agreement | 159,604 | 159,604 | 159,604 | |
| Guarantee deposits | 367,122 | 144,691 | 106,901 | |
| Installation expenses | 1,590,033 | 1,444,496 | 635,828 | |
| Prepaid expenses | 57,113 | 57,166 | 37,113 | |
| Other expenses | 460,934 | 232,759 | 686,268 | |
| 3,416,610 | 2,820,520 | 2,407,518 | ||
| Accumulated amortization | (2,013,515) | (1,783,501) | (1,693,941) | |
| $ 1,403,095 | $ 1,037,019 | $ 713,577 |
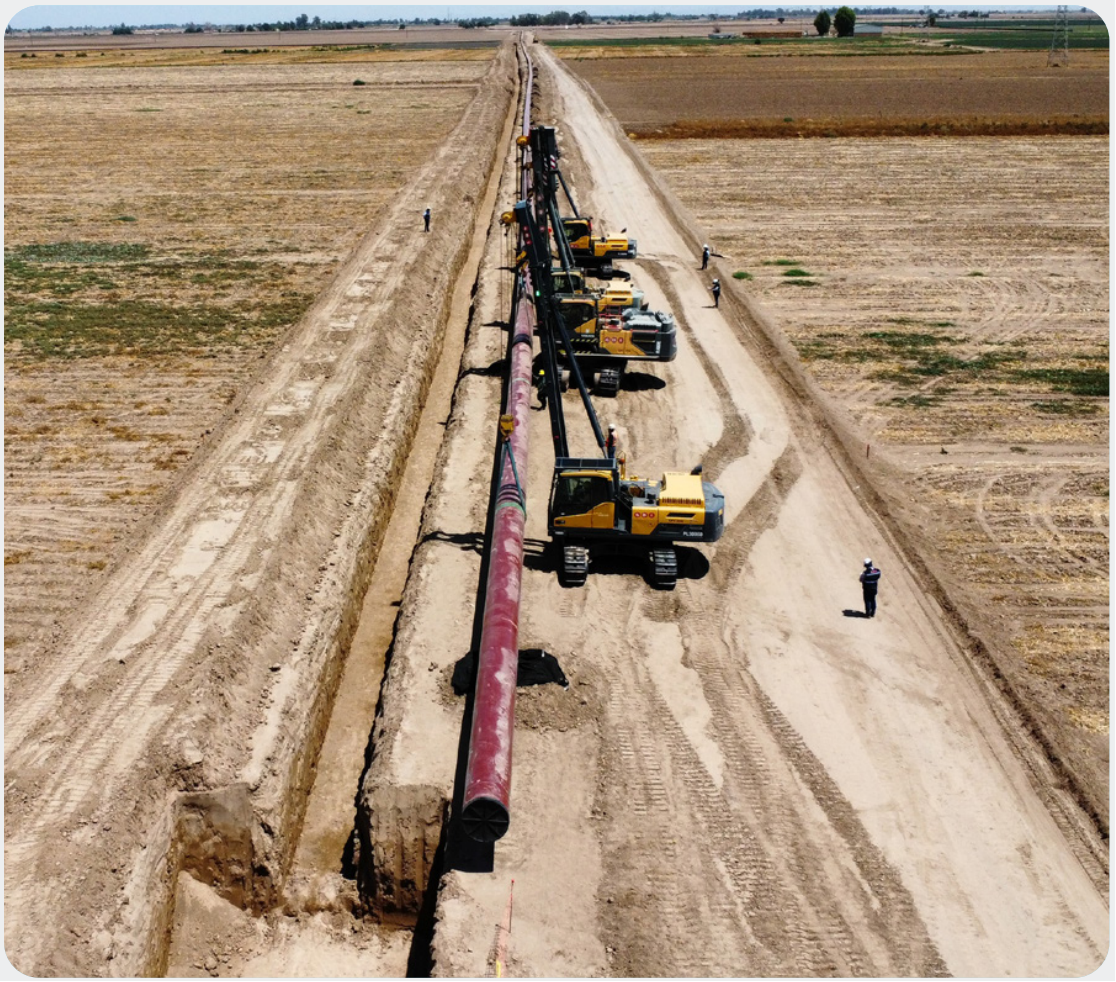
(a) The insurance and bonds of CICSA have a duration based on the contracted projects which is an average of between 2 to 3 years.
The amortization recorded in results was $230,014, $280,665 and $142,812 in 2025, 2024 and 2023, respectively, of which $222,909, $256,375 and $122,900 is recognized as part of cost of sales at that date.
19. Intangible assets
| Years of amortization | Balances as of January 1, 2025 | Additions | Additions due to Business Combination | Retirements / disposals | Exchange differences on translation | Balances as of December 31, 2025 | |
|---|---|---|---|---|---|---|---|
| Cost: | |||||||
| Goodwill | Indefinite | $ 5,700,159 | $ - | $ - | $ (132,613) | $ (389) | $ 5,567,157 |
| Commercial trademarks | 15.5 | 437,554 | 5,990 | - | - | (596) | 442,948 |
| Exploration and evaluation | Indefinite | 4,300,677 | - | - | (1,359) | - | 4,299,318 |
| Computer programs | 5.83 | 898,838 | 31,512 | - | (76,084) | (7,567) | 846,699 |
| Licenses and franchises | 4 | 284,567 | 25,389 | - | - | (4,540) | 305,416 |
| Industrial property rights | 10 | 313,842 | 21,225 | - | - | - | 335,067 |
| Intangible assets under development | 15 | 103,215 | 10,010 | - | (1,548) | - | 111,677 |
| Non-compete contract | 10 | 46,987 | - | - | - | - | 46,987 |
| Other intangible assets | Indefinite | 407,970 | 741 | - | (24,064) | (248,392) | 136,255 |
| Total cost | 12,493,809 | 94,867 | - | (235,668) | (261,484) | 12,091,524 | |
| Accumulated amortization: | |||||||
| Commercial trademarks | (54,508) | (3,661) | - | - | 693 | (57,476) | |
| Exploration and evaluation | (33,464) | - | - | (283,834) | (37) | (317,335) | |
| Computer programs | (788,004) | (43,443) | - | 73,642 | 7,545 | (750,260) | |
| Licenses and franchises | (251,794) | (41,088) | - | (9,562) | 16,285 | (286,159) | |
| Industrial property rights | (313,211) | - | - | - | - | (313,211) | |
| Intangible assets under development | (84,816) | (26,267) | - | - | - | (111,083) | |
| Non-compete contract | (46,987) | - | - | - | - | (46,987) | |
| Other intangible assets | (120,334) | - | - | 12,264 | 92,088 | (15,982) | |
| Total amortization | (1,693,118) | (114,459) | - | (207,490) | 116,574 | (1,898,493) | |
| Impairment adjustments | |||||||
| Exploration and evaluation | (1,413,333) | (1,116,446) | - | - | - | (2,529,779) | |
| $ 9,387,358 | $ (1,136,038) | $ - | $ (443,158) | $ (144,910) | $ 7,663,252 | ||
| Years of amortization | Balances as of January 1, 2024 | Additions | Additions due to Business Combination | Retirements / disposals | Exchange differences on translation | Balances as of December 31, 2024 | |
|---|---|---|---|---|---|---|---|
| Cost: | |||||||
| Goodwill | Indefinite | $ 4,461,294 | $ - | $ 1,494,932 | $ (334,398) | $ 78,331 | $ 5,700,159 |
| Commercial trademarks | 15.5 | 1,456,947 | 16 | - | - | (1,019,409) | 437,554 |
| Exploration and evaluation | Indefinite | 3,868,152 | 432,525 | - | - | - | 4,300,677 |
| Computer programs | 5.83 | 992,104 | 32,551 | - | - | (125,817) | 898,838 |
| Licenses and franchises | 4 | 264,567 | 23,874 | - | - | (3,874) | 284,567 |
| Industrial property rights | 10 | 313,842 | - | - | - | - | 313,842 |
| Intangible assets under development | 15 | 89,349 | 17,167 | - | (3,301) | - | 103,215 |
| Exclusive distribution rights | 10 | 375,469 | - | - | - | (375,469) | - |
| Non-compete contract | 10 | 545,269 | - | - | - | (498,282) | 46,987 |
| Other intangible assets | Indefinite | 320,376 | - | - | (11,800) | 99,394 | 407,970 |
| Total cost | 12,687,369 | 506,133 | 1,494,932 | (349,499) | (1,845,126) | 12,493,809 | |
| Accumulated amortization: | |||||||
| Commercial trademarks | (86,522) | (3,203) | - | - | 35,217 | (54,508) | |
| Exploration and evaluation | (33,464) | - | - | - | - | (33,464) | |
| Computer programs | (865,815) | (44,096) | - | - | 121,907 | (788,004) | |
| Licenses and franchises | (222,230) | (23,331) | - | - | (6,233) | (251,794) | |
| Industrial property rights | (313,211) | - | - | - | - | (313,211) | |
| Intangible assets under development | (69,356) | (15,460) | - | - | - | (84,816) | |
| Exclusive distribution rights | (225,438) | - | - | - | 225,438 | - | |
| Non-compete contract | (403,827) | - | - | - | 356,840 | (46,987) | |
| Other intangible assets | (88,771) | (2,174) | - | - | (29,389) | (120,334) | |
| Total amortization | (2,308,634) | (88,264) | - | - | 703,780 | (1,693,118) | |
| Impairment adjustments | |||||||
| Exploration and evaluation | (1,413,333) | - | - | - | - | (1,413,333) | |
| $ 8,965,402 | $ 417,869 | $ 1,494,932 | $ (349,499) | $ 1,141,346 | $ 9,387,358 | ||
| Years of amortization | Balances as of January 1, 2023 | Additions | Additions due to Business Combination | Retirements / disposals | Exchange differences on translation | Balances as of December 31, 2023 | |
|---|---|---|---|---|---|---|---|
| Cost: | |||||||
| Goodwill | Indefinite | $ 4,518,576 | $ - | $ - | $ (389,249) | $ 331,967 | $ 4,461,294 |
| Commercial trademarks | 15.5 | 1,606,383 | 341 | - | (1,020,135) | 870,358 | 1,456,947 |
| Exploration and evaluation | Indefinite | 3,879,679 | - | - | (37,843) | 26,316 | 3,868,152 |
| Computer programs | 5.83 | 978,640 | 38,453 | - | (97,463) | 72,474 | 992,104 |
| Licenses and franchises | 4 | 258,255 | 6,063 | - | - | 249 | 264,567 |
| Industrial property rights | 10 | 313,211 | 631 | - | - | - | 313,842 |
| Intangible assets under development | 15 | 89,289 | 2,250 | - | - | (2,190) | 89,349 |
| Exclusive distribution rights | 10 | 426,265 | - | - | (375,469) | 324,673 | 375,469 |
| Non-compete contract | 10 | 609,226 | - | - | (498,282) | 434,325 | 545,269 |
| Other intangible assets | Indefinite | 317,934 | - | - | - | 2,442 | 320,376 |
| Total cost | 12,997,458 | 47,738 | - | (2,418,441) | 2,060,614 | 12,687,369 | |
| Accumulated amortization: | |||||||
| Commercial trademarks | (89,213) | (3,261) | - | 35,664 | (29,712) | (86,522) | |
| Exploration and evaluation | (33,464) | - | - | - | - | (33,464) | |
| Computer programs | (837,570) | (44,617) | - | 91,749 | (75,377) | (865,815) | |
| Licenses and franchises | (197,850) | (28,969) | - | - | 4,589 | (222,230) | |
| Industrial property rights | (313,211) | - | - | - | - | (313,211) | |
| Intangible assets under development | (65,187) | (6,360) | - | - | 2,191 | (69,356) | |
| Exclusive distribution rights | (261,207) | (1,507) | - | 219,386 | (182,110) | (225,438) | |
| Non-compete contract | (385,823) | 0 | - | 356,840 | (374,844) | (403,827) | |
| Other intangible assets | (17,618) | (1,908) | - | - | (69,245) | (88,771) | |
| Total amortization | (2,201,143) | (86,622) | - | 703,639 | (724,508) | (2,308,634) | |
| Impairment adjustments | |||||||
| Exploration and evaluation | (1,413,333) | - | - | - | - | (1,413,333) | |
| $ 9,382,982 | $ (38,884) | $ - | $ (1,714,802) | $ 1,336,106 | $ 8,965,402 | ||
20. Short and long-term debt
Are composed as follows:
| Concept | 2025 | 2024 | 2023 |
|---|---|---|---|
| Short-term: | |||
| Unsecured loans in Mexican pesos with current rates of 11.97% to 13.51% and due dates in January, February, July and November 2025. | $ - | $ - | $ 11,073,302 |
| Unsecured loans in Mexican pesos with current rates ranging from 10.7429% to 12.22% and maturity dates in January, March, and June 2025. | - | 5,840,762 | - |
| Unsecured loans in US dollars with current rates ranging from 4.77% to 10.69% and maturity dates in January, February, March, and June 2025. | - | 3,547,622 | - |
| Unsecured loans in Mexican pesos with current rates of 7.86% to 9.05% and maturity dates of January, April and November 2026. | 5,273,283 | - | - |
| Unsecured loans in US dollars with current rate of 5.94% due in June 2025. | - | - | 591,273 |
| Unsecured loans in US dollars with current rates of 5.60% to 6.06% with maturity dates in August 2026. | 2,102,104 | - | - |
| Unsecured loans in Colombian pesos with due dates in January 2025 at a rate of 14.11% | - | - | 105,600 |
| Stock certificate in Mexican peso with a current rate of 10.73% maturing in March 2025 | - | 2,000,000 | - |
| Mexican peso stock certificates with a current rate of 11.70% with maturity dates in March 2025 | - | - | 6,000,000 |
| Mexican peso-denominated stock certificates with a current rate of 7.83% to 9.10% with maturity dates in May and October 2026. | 6,700,000 | - | - |
| Other loans | 132,789 | 110,890 | 89,150 |
| 14,208,176 | 11,499,274 | 17,859,325 | |
| Add current portion of long-term debt | 1,184,934 | 876,361 | 1,237,853 |
| Short-term debt | $ 15,393,110 | $ 12,375,635 | $ 19,097,178 |
| 2025 | 2024 | 2023 | |
|---|---|---|---|
| Long-term debt: | |||
| Syndicated Loan of US, with a current rate 5.39%, with maturity in 2035. | $ — | $ — | $ 7,355,044 |
| Loans in Mexican pesos with current rates of 12.17% to 12.82% and due dates in 2025 and 2025. | — | — | — |
| Loans in Mexican pesos with current rates of 12.68% maturing in November 2026. | — | 2,062,505 | — |
| Loans in foreign currency with current rates ranging from 4.34% to 6.64% and maturity dates from 2027 to 2039. | — | 13,339,388 | — |
| Loans in Mexican pesos with current rates of 8.18% to 13.15% and due dates in 2025 and 2026. | — | — | 3,956,098 |
| Loans in US dollars with current rates of 0.50% to 7.00% and due dates from 2024 to 2035. | — | — | — |
| Foreign currency loans with current rates of 0.50% to 13.49% and maturity dates from 2025 to 2035. | — | — | 5,431,453 |
| Government loan in Mexican pesos with a current rate of 8.47% and a maturity date in 2026. | 655,365 | — | — |
| Loan from a Government Agency in Mexican pesos with a current rate of 12.96% and maturity in 2029. | — | 2,055,556 | 2,448,382 |
| Bond certificate in Mexican pesos with current rates ranging from 10.52% to 12.57% and maturity dates in 2026, 2027, and 2031. | — | 18,700,000 | — |
| Stock certificate in Mexican pesos with current rate of 11.80% and 13.11% with due dates in 2026. | — | — | 8,700,000 |
| Mexican peso-denominated stock certificates with current rates between 7.73% and 10.52% with maturity dates in 2027 and 2031. | 10,000,000 | — | — |
| Foreign currency loans with current rates of 4.34% to 6.06% and maturity dates from 2030 to 2035. | 11,943,428 | — | — |
| Other loans | — | 437 | — |
| 22,598,793 | 36,157,886 | 27,890,977 | |
| Less – current portion of long-term debt | (1,184,934) | (876,361) | (1,237,853) |
| Long-term debt | $ 21,413,859 | $ 35,281,525 | $ 26,653,124 |
Long-term debt accrues interest at variable rates. Interest rates for loans in Mexican pesos during 2025, 2024 and 2023 were a weighted average of 7.00%, 12.00%, and 12.74%
The affirmative covenants assumed by the Entity as a result of these loans are as follows: i) provide audited consolidated financial statements within 120 days after the year-end close; ii) provide internal consolidated financial statements within 60 days after the close of the first three quarters of the year; iii) maintain its legal capacity and continue as a going concern; and iv) comply with applicable laws, environmental regulations and maintain permits, licenses and other similar documents.
The negative covenants assumed by the Entity as a result of these loans are as follows: i) refrain from modifying the main line of business; ii) refrain from assuming or attaching liens and encumbrances on its properties or assets, unless permitted; iii) refrain from disposing of all or substantially all of its assets, unless permitted; iv) refrain from merging, dissolving, liquidating or performing a corporate breakup, unless permitted.
21. Trade accounts payable
Accounts payable and trade accounts payable mainly comprise outstanding amounts for commercial purchases and ongoing costs. The average credit period for the purchase of certain goods is 3 months.
The Entity has implemented financial risk management policies to ensure that all accounts payable are paid in accordance with previously agreed credit terms.
The Entity has entered into financial factoring contracts in the supplier modality with various banking institutions. The operation consists of purchasing documents from these suppliers that are payable by the Entity.
The Entity does not incur any operational or financial costs related to this financial factoring; these operational and financial costs are absorbed by the suppliers within this scheme.
As the agreement does not allow the Entity to have financing related to this factoring, the amount payable to the banking institutions is the same as what would have been paid to its supplier, therefore the Entity considers that the amounts payable to these banking institutions should be classified as accounts payable. The maximum amount used in the month during the year under the financial factoring scheme was $588 million pesos. At the end of 2025, 2024, and 2023, 3%, 2%, and 2%, respectively, of the accounts payable were under these agreements.
Management considers that the carrying value of trade accounts payable approximates their fair value.
| 2025 | 2024 | 2023 | |
|---|---|---|---|
| Trade accounts payable | $ 18,620,285 | $ 21,085,915 | $ 18,213,507 |
| Trade accounts payable through financial factoring | 521,031 | 414,797 | 440,334 |
| $ 19,141,316 | $ 21,500,712 | $ 18,653,841 |
22. Other accounts payable and accrued liabilities
Other accounts payable and accrued liabilities are composed as follows:
| 2025 | 2024 | 2023 | |
|---|---|---|---|
| Taxes payable | $ 5,864,288 | $ 5,606,779 | $ 6,043,099 |
| Other accounts payable | 4,179,520 | 4,520,260 | 3,868,139 |
| $ 10,043,808 | $ 10,127,039 | $ 9,911,238 |
23. Provisions
| 2025 | ||||||
|---|---|---|---|---|---|---|
| Opening balance | Additions | Provision applied | Reclassifications | Reversals | Closing balance | |
| Contractor costs | $ 5,561,902 | $ 30,258,983 | $ (29,582,876) | $ - | $ - | $ 6,238,009 |
| Construction and other extraordinary costs | 813,711 | 1,750,461 | (1,449,683) | - | - | 1,114,489 |
| Environmental and plant closure costs | 99,920 | 390,008 | (364,175) | - | - | 125,753 |
| Labor relations | 164,058 | 531,037 | (605,787) | - | - | 89,308 |
| Other provisions | 1,678,993 | 9,649,719 | (9,881,133) | - | - | 1,447,579 |
| $ 8,318,584 | $ 42,580,208 | $ (41,883,654) | $ - | $ - | $ 9,015,138 | |
| 2024 | ||||||
|---|---|---|---|---|---|---|
| Opening balance | Additions | Provision applied | Reclassifications | Reversals | Closing balance | |
| Contractor costs | $ 4,810,792 | $ 40,937,333 | $ (40,186,223) | $ - | $ - | $ 5,561,902 |
| Construction and other extraordinary costs | 667,575 | 1,522,559 | (1,369,472) | - | (6,951) | 813,711 |
| Environmental and plant closure costs | 71,808 | 70,903 | (42,791) | - | - | 99,920 |
| Labor relations | 271,167 | 132,174 | (239,283) | - | - | 164,058 |
| Other provisions | 1,370,703 | 3,240,123 | (2,931,833) | - | - | 1,678,993 |
| $ 7,192,045 | $ 45,903,092 | $ (44,769,602) | $ - | $ (6,951) | $ 8,318,584 | |
| 2023 | ||||||
|---|---|---|---|---|---|---|
| Opening balance | Additions | Provision applied | Reclassifications | Reversals | Closing balance | |
| Contractor costs | $ 6,883,153 | $ 23,601,328 | $ (25,673,689) | $ - | $ - | $ 4,810,792 |
| Construction and other extraordinary costs | 705,085 | 1,474,826 | (1,512,336) | - | - | 667,575 |
| Environmental and plant closure costs | 83,470 | 11,613 | (23,275) | - | - | 71,808 |
| Labor relations | 268,899 | 75,335 | (73,067) | - | - | 271,167 |
| Other provisions | 1,438,114 | 33,028,541 | (33,095,952) | - | - | 1,370,703 |
| $ 9,378,721 | $ 58,191,643 | $ (60,378,319) | $ - | $ - | $ 7,192,045 | |
24. Retirement and other employee benefits
The Entity has defined benefit plans for eligible employees at most of its subsidiaries, which include retirement, death or total disability payments for non-unionized personnel. These defined benefit plans are managed by a fund that is legally separate from the Entity. The board of directors of the pension fund is composed by an equal number of representatives of both the employers and (former) employees. The board of directors of the pension fund is required according to the law and the bylaws of the association to act in the interests of the fund and all interested parties; i.e., active and inactive employees, retirees and the employer. The board of directors of the pension fund is responsible for the investment policy applied to fund assets.
The Entity manages a plan that also covers seniority premiums for all staff working in Mexico, which consists of a single payment equal to 12 days’ salary for each year worked based on final salary, albeit limited to two times the legal minimum wage.
Under these plans, employees are entitled to retirement benefits, which, added to the legal pension, represent an income at age 65. No other postretirement benefits are awarded.
The plans typically expose the Entity to actuarial risks such as the investment risk, interest rate risk, longevity risk and salary risk.
| Investment risk | The present value of the defined benefit plan liability is calculated by using a discount rate determined according to government bond returns; if the plan asset return is below this rate, a plan deficit will arise. The plan currently has a relatively balanced investment in variable yield securities, debt instruments and real property. Given the long-term nature of plan liabilities, the board of directors of the pension fund considers that it is to invest a reasonable portion of the plan assets in variable yield securities and real estate to leverage the return generated by the fund. |
| Interest risk | A bond interest rate decrease will increase plan liabilities; however, this will be partially offset by the increased return derived from plan debt investments. |
| Longevity risk | The present value of the defined benefit obligations is calculated based on the best estimate of plan participant mortality, both during and after their employment. The increased life expectancy of plan participants will increase plan liabilities. |
| Salary risk | The present value of the defined benefit obligations is calculated according to the future salaries of plan participants. As such, higher plan participant salaries will increase plan liabilities. |
The most recent actuarial valuations of plan assets and the present value of the defined benefit obligation were made as of December 31, 2025 with information as of October 31, 2025 by independent actuaries, members of the Mexican Association of Consulting Actuaries, A. C. The present value of the defined benefit obligation and the labor cost of the current service and the cost of past services were calculated using the projected unit credit method.
No other post-retirement benefits are provided to these employees.
The main assumptions used for these actuarial valuations were as follows:
| 2025 | 2024 | 2023 | |
|---|---|---|---|
| Discount rate | 7.58% | 9.01% | 9.57% |
| Expected rate of salary increase | 3.84% | 4.86% | 5.14% |
| Expected return on plan assets | 3.69% | 7.51% | 9.46% |
| Retirement age for current pensioners (years) | |||
| Men and women | 70 | 70 | 71 |
The amount recognized in the consolidated statements of financial position regarding the Entity’s defined benefit plan obligation are as follows.
| 2025 | 2024 | 2023 | |
|---|---|---|---|
| Present value of the obligation from funded defined benefits | $ (7,139,912) | $ (6,230,355) | $ (6,973,208) |
| Fair value of plan assets | 7,486,716 | 6,788,997 | 7,266,298 |
| Excess of plan assets as regards defined benefit obligation | $ 346,804 | $ 558,642 | $ 293,090 |
| The balances included in the consolidated statements of changes in financial position are as follows: | |||
| Liabilities from employee defined retirement benefits | $ (731,097) | $ (599,721) | $ (936,492) |
| Assets from employee defined retirement benefits | 1,077,901 | 1,158,363 | 1,229,582 |
| $ 346,804 | $ 558,642 | $ 293,090 | |
| Fund contributions | $ 164,257 | $ 61,874 | $ 31,748 |
The expense of the year is a $156,886, $120,894 and $135,311 in 2025, 2024 and 2023, respectively, and has been included in the statement of income as the cost of sales, administrative and sales expenses
The remeasurement of the defined benefit liability is recognized in other comprehensive income.
The net cost of the period is composed as follows:
| 2025 | 2024 | 2023 | |
|---|---|---|---|
| Current labor service cost | $ 224,067 | $ 184,486 | $ 248,908 |
| Interest cost | 516,627 | 579,508 | 504,089 |
| Interest income | (582,890) | (632,891) | (615,756) |
| Labor cost of past services | 863,944 | (22) | 2,067 |
| Effect of any reduction or early settlement (other than a restructuring or a discontinued operation) | (864,862) | (10,187) | (3,997) |
| Net cost of the period | $ 156,886 | $ 120,894 | $ 135,311 |
Defined benefit cost entries recognized in other comprehensive income:
| 2025 | 2024 | 2023 | |
|---|---|---|---|
| Actuarial (loss) gain | $ (135,283) | $ (139,047) | $ (34,589) |
As there is no legal right to offset employee retirement benefits between different Group subsidiaries, these amounts are not offset and are presented as long-term assets or liabilities in the accompanying consolidated statements of changes in financial position.
Changes in the present value of the defined benefit obligation:
Changes in the present value of plan assets in the current period:
| 2025 | 2024 | 2023 | |
|---|---|---|---|
| Opening balance of defined benefit obligation | $ (6,230,355) | $ (6,973,208) | $ (6,809,121) |
| Current service cost | (224,067) | (184,486) | (248,908) |
| Past service cost | (863,944) | 22 | (2,067) |
| Interest cost | (516,627) | (579,508) | (504,089) |
| Actuarial (losses) gains | (169,913) | 85,913 | (32,501) |
| Benefits paid | 475,965 | 399,181 | 423,389 |
| Effect of any reduction or early settlement (other than restructuring or a discontinued operation) | 798,518 | 13,734 | (2,011) |
| Effects of discontinuation | - | 1,213,880 | - |
| Others | (409,489) | (205,883) | 202,100 |
| Closing balance of the defined benefit obligation | $ (7,139,912) | $ (6,230,355) | $ (6,973,208) |
| 2025 | 2024 | 2023 | |
|---|---|---|---|
| Initial fair value of plan assets | $ 6,788,997 | $ 7,266,298 | $ 7,455,892 |
| Expected yield on plan assets | 582,890 | 632,891 | 615,756 |
| Personnel transfers | - | (443) | (3,449) |
| Actuarial gains (losses) | 7,044 | (329,716) | (583,870) |
| Plan contributions | 164,257 | 61,874 | 31,748 |
| Benefits paid | (475,965) | (399,181) | (423,389) |
| Business acquisition | - | - | - |
| Effects of discontinuation | - | (852,853) | - |
| Other | 419,493 | 410,127 | 173,610 |
| Final fair value of plan assets | $ 7,486,716 | $ 6,788,997 | $ 7,266,298 |
Significant actuarial assumptions used to determine the defined obligation are the discount rate, expected salary increase and mortality. The following sensitivity analyses have been determined based on reasonably possible changes to the respective assumptions at the end of the reporting period, while all other hypotheses remain constant.
If the discount rate were 50 basis points higher (lower), the defined benefit obligation would decrease by $247,060 in 2025 (increase of $293,379).
If the expected salary growth increases (decreases) by 0.5%, the defined benefit obligation would increase by $223,631 in 2025 (decrease of $206,869).
If the life expectancy increases (decreases) by one year for both men and women, the defined benefit obligation would increase by $121,982 in 2025 (decrease of $114,052).
The sensitivity analysis presented above may not be representative of the actual change in the defined benefit obligation, as it is unlikely that the modification of hypotheses would occur in an isolated manner as certain assumptions may be correlated. Furthermore, when presenting the above sensitivity analysis, the present value of the defined benefit obligation has been calculated by using the projected unit credit method at the end of the reporting period, which is the same as the value applied to calculate the defined benefit obligation liability recognized in the statement of financial position.
There was no change as regards the methods and assumptions used to prepare the sensitivity analysis over prior years./p>
The main strategic decisions formulated in the fund’s actuarial and technical policy document are as follows: combination of assets based on 71.0% capital instruments and 29% debt instruments.
The average duration of the defined benefit obligation as of December 31, 2025 is 7.33 years, 7.53 years in 2024 and 8.74 years in 2023.
The Entity expects to make a contribution of $236,626 in 2026 to defined benefit plans.
The main categories of plan assets are:
The fair value of the capital and debt instruments mentioned above is determined according to the market prices listed on active markets, while the market values of properties are not based on market prices listed on active markets.
Employee benefits granted to the Entity’s key management personnel and/or directors were as follows:
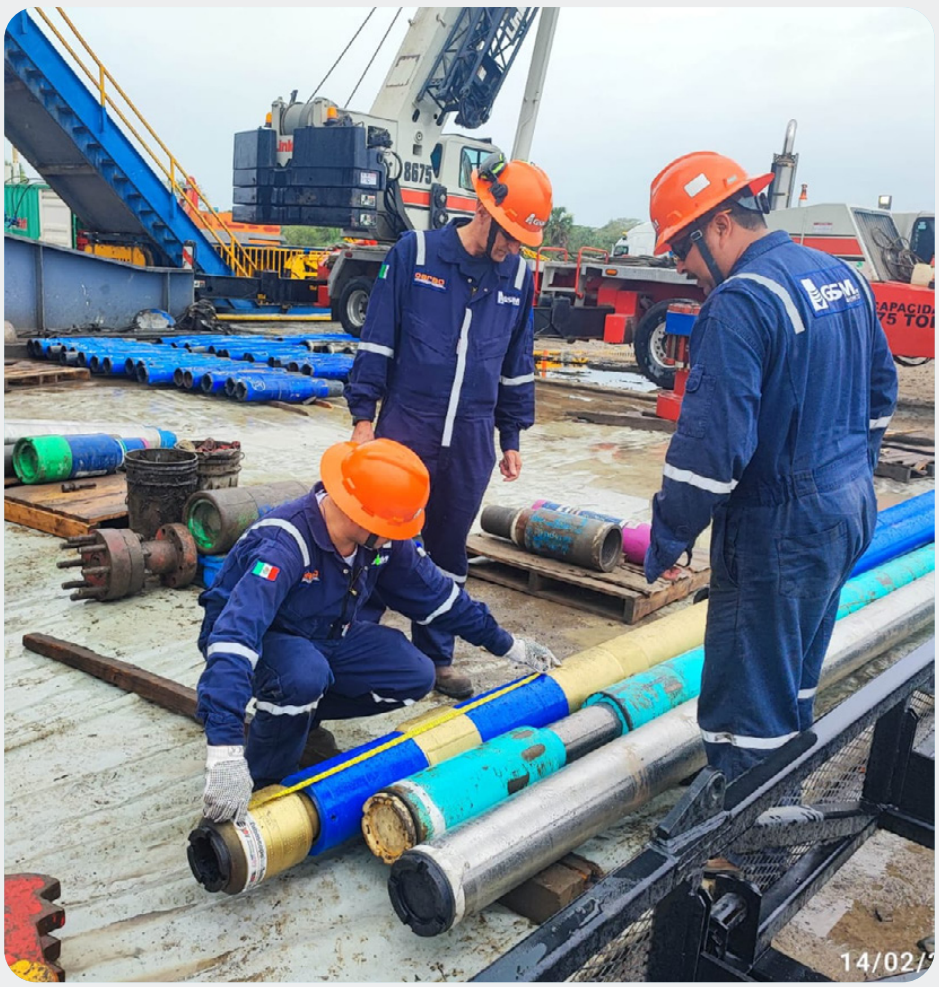
| Fair value of plan assets | ||||||
|---|---|---|---|---|---|---|
| 2025 % | 2024 % | 2023 % | 2025 | 2024 | 2023 | |
| Capital instruments | 71 | 71 | 70 | $ 5,309,785 | $ 4,852,456 | $ 5,086,717 |
| Debt instruments | 29 | 29 | 30 | $ 2,176,931 | $ 1,936,541 | $ 2,179,581 |
| Weighted average expected return | $ 972,966 | $ 661,698 | $ 656,743 | |||
| 2025 | 2024 | 2023 | |
|---|---|---|---|
| Short-term benefits | $ 120,449 | $ 126,180 | $ 173,588 |
| Defined benefit plans | 370 | 325 | 257 |
| Other long-term benefits | 409,81 | 382,903 | 377,914 |
25. Stockholders’ equity
- The historical amount of subscribed and paid-in common stock of Grupo Carso as of December 31, 2025, 2024 and 2023 is as follows:
| 2025 | 2024 | 2023 | 2025 | 2024 | 2023 | |
|---|---|---|---|---|---|---|
| Serie A1 | 2,261,166,416 | 2,261,166,416 | 2,261,166,416 | $ 530,746 | $ 530,746 | $ 530,746 |
| Repurchased shares held by the Treasury | (7,632,772) | (5,854,829) | (4,037,963) | $ (1,791) | $ (1,374) | $ (948) |
| Historical common stock | 2,253,533,644 | 2,255,311,587 | 2,257,128,453 | $ 528,955 | $ 529,372 | $ 529,798 |
Common stock is composed by ordinary, nominative shares at no par value
At the Ordinary General Meeting of Shareholders of Grupo Carso held on April 30, 2025, the payment of a cash dividend of $1.50 (one peso and fifty cents M.N.) per share was authorized, drawn from the balance of the Net Tax Profit Account (CUFIN), payable in two equal installments of $0.75 (seventy-five cents) per share, the first payable starting on June 30 and the second starting on December 19, 2025, against coupons number 50 and 51, respectively, on the shares outstanding at the time the corresponding payments were made. This payment amounted to $3,381,596.
At the Ordinary General Shareholders’ Meeting of Grupo Carso held on April 30, 2024, the payment of a cash dividend of $1.50 (one peso and fifty cents M.N.) per share was authorized, from the balance of the Net Tax Profit Account (CUFIN), payable in two equal installments of $0.75 (seventy-five cents) per share, payable the first starting from June 28 and the second starting from December 20, 2024, against coupons numbers 48 and 49, respectively, on the outstanding securities at the time of the corresponding payments. This payment amounted to $3,383,669.
The Ordinary General Meeting of the Stockholders of Grupo Carso of April 27, 2023 authorized the payment of a cash dividend of $1.20 (one peso) per share to be taken the balance of the Net Tax Income Account (CUFIN), payable, at the election of each shareholder, in cash or in series A-1 shares or in a combination of both, this dividend would be distributed through two payments of $0.60 (fifty cents) per share, per share, the first payable as of June 30 and the second as of December 20 2023, against coupons numbers 46 and 47, respectively, on the outstanding titles when the corresponding payments are made. Said payment amounted to $1,322,390.
- Retained earnings include the legal reserve. According to the General Corporate Law, at least 5% of net profit of the year must be used to create a legal reserve until equal to 20% of common stock at face value. The legal reserve may be capitalized but must not be distributed unless the Entity is dissolved and must be replenished whenever decreased for any reason. As of December 31, 2025, 2024 and 2023, the Entity’s legal reserve was $381,635.
- Stockholders’ equity except for the restated paid-in capital and tax-retained earnings, will be subject to ISR payable by the Entity at the rate in effect upon distribution. Any tax paid on such distribution may be credited against annual and estimated ISR of the year in which the tax on dividends is paid and the following two fiscal years.
- An additional amount of income tax (ISR) is payable at the 10% rate on dividends paid to individuals and foreign residents. The ISR is paid through a tax withholding and is considered as a definitive payment for each stockholder. Foreign stockholders may apply the terms of tax treaties. This tax is applicable to the distribution of profits generated as of 2014.
26. Balances and transactions with related parties
Related-party receivable and payable balances are as follows:
| 2025 | 2024 | 2023 | |
|---|---|---|---|
| Receivable- | |||
| APTIV Contract Cervices Norest | $ 637,212 | $ 748,303 | $ 763,283 |
| Red Nacional Última Milla, S. A. P. I. de C. V. | 551,830 | 472,141 | 2,121,955 |
| Teléfonos de México, S. A. B. de C. V. | 147,825 | 330,198 | 88,655 |
| Infraestructura y Saneamiento de Atotonilco, S. A. de C. V. | 145,173 | 47,234 | 142,685 |
| Comunicación Celular, S. A. de C. V. | 138,635 | 116,495 | 145,688 |
| América Móvil Perú, S. A. C. | 121,440 | 103,852 | 84,740 |
| Constructora MT Oaxaca, S. A. de C. V. | 86,242 | - | 82,264 |
| Inmuebles Srom, S.A. de C.V. | 82,031 | - | - |
| Star Medica, S.A. de C.V. | 80,487 | - | - |
| Fieldwoor Energy E&P Mexico | 76,599 | - | - |
| Claro, S. A. | 64,584 | 91,153 | 63,553 |
| Radiomóvil Dipsa, S. A. de C. V. | 66,835 | 87,024 | 53,681 |
| FCC Construcción S. A. Sucursal de México | 53,143 | - | 198,059 |
| Servicios CVTM, S. A. de C. V. | 46,429 | - | 26,247 |
| Consorcio Tramo Dos, S. A. de C. V. | 41,668 | 99,663 | 183,736 |
| FCC Servicios Industriales Y Energéticos México, S. A. de C. V. | 40,262 | - | - |
| Consorcio Ecuatoriano de Telecomunicaciones, S. A. | 39,864 | 51,921 | 17,523 |
| Empresa de Servicios y Soporte Integral GC. S.A.P.I. | 39,516 | 57,980 | 1,275,829 |
| Consorcio FCC Américas, APCA | 32,812 | - | - |
| Claro CR Telecomunicaciones, S. A. | 31,820 | 48,497 | 41,878 |
| Concesionaria autopista Guadalajara-Tepic, S. A. de C. V. | 31,718 | - | 42,558 |
| Telecomunicaciones de Guatemala, S. A. | 29,140 | 51,440 | 40,943 |
| Desarrolladora Multimodal Istmo de Tehuantepec, S. A. P. I. de C. V. | 27,858 | - | - |
| Empresa Nicaragüense de Telecomunicaciones, S. A. | 22,950 | - | 24,639 |
| Uninet, S. A. de C. V. | 21,315 | 51,035 | 15,339 |
| Servicios de Comunicaciones de Honduras, S. A. de C. V. | 17,951 | 21,220 | 52,293 |
| Inmobiliaria SM de Guadalajara, S. A. de C. V. | 14,427 | - | - |
| Inmobiliaria SM de Puebla, S. A. de C. V. | 14,393 | - | - |
| Seguros Inbursa, S. A. de C. V. | 13,794 | - | - |
| Puerto Rico Telephone Company, INC. | 13,227 | 17,798 | 5,655 |
| Compañía de Teléfonos y Bienes Raíces, S. A. de C. V. | 10,598 | 9,183 | 44,843 |
| Red Última Milla del Noroeste, S. A. P. I. de C. V. | 10,257 | 39,074 | 52,815 |
| CTE Telecom Personal, S. A. de C. V. | - | 23,816 | 22,571 |
| Telmex Colombia, S. A. | - | 18,260 | 25,920 |
| Compañía Dominicana de Teléfonos, S. A. | - | 11,845 | 2,430 |
| Conductores Monterrey, S. A. de C. V. | - | 10,300 | 3,703 |
| Compañía de Telecomunicaciones de el Salvador, S. A. de C. V. | - | 9,647 | - |
| Operadora de Sites Mexicanos, S. A. de C. V. | - | 1,433 | 28,347 |
| Promotora del Desarrollo de América Latina, S. A. de C. V. | - | 310 | 98,025 |
| 2025 | 2024 | 2023 | |
|---|---|---|---|
| Alquiladora de Casas, S. A. de C. V. | - | 47 | 12,369 |
| Autovía Mitla Tehuantepec, S. A. de C. V. | - | - | 797,034 |
| Claro Comunicaciones, S. A | - | - | 36,627 |
| Bajasur, S. A. de C. V. | - | - | 26,077 |
| Telecom Publicar Directorios. S. A. de C. V. | - | - | 24,636 |
| Concesionaria de Carreteras y Libramientos del Pacífico Norte, S. A. de C. V. | - | - | 11 |
| Fideicomiso Opsimex 4594 | - | - | 8,930 |
| Fundación Carlos Slim, A. C. | - | - | 3,442 |
| Ocampo Mining, S. A. de C. V. | - | - | 1,244 |
| Others | 94,642 | 50,678 | 84,702 |
| $ 2,846,677 | $ 2,570,547 | $ 6,744,929 | |
| Payable- | |||
| Talos Energy Inc. | $ 896,538 | $ 1,011,388 | $ 842,986 |
| Radiomóvil Dipsa, S. A. de C. V. | 408,162 | 329,297 | 132,451 |
| Fieldwood Energy E&P Mexico | 118,214 | - | - |
| FCC Construcción, S.A. Sucursal México | 114,807 | 211,093 | 88,772 |
| Transform SR Brands LLC | 110,532 | 110,203 | 113,840 |
| JM Distribuidores, S. A. | 72,394 | 80,090 | 71,302 |
| América Móvil Perú, S. A. C. | 66,015 | 33,429 | 14,217 |
| Aptiv Services US, LLC. | 44,093 | - | 87,749 |
| Inmose, S. A. de C. V. | 40,413 | 54,881 | 48,910 |
| Delphi Packard Electric Systems, Inc. | 35,662 | 51,292 | - |
| Red Nacional Última Milla, S.A.P.I. de C.V. | 33,816 | 23,319 | - |
| Seguros Inbursa, S. A. | 30,818 | 5,181 | 18,843 |
| Inmuebles SROM, S. A. de C. V. | 30,680 | 52,687 | 25,620 |
| Uninet, S.A. de C.V. | 28,019 | 32,966 | 18,205 |
| Consorcio Cargi - Propen, S.A. de C.V. | 26,000 | 30,346 | 26,351 |
| Desarrollos Sagesco, S.A. de C.V. | 14,121 | 14,033 | 10,628 |
| Concesionaria ETRAM Cuatro Caminos, S.A. de C.V. | 11,744 | 12,319 | 12,300 |
| Acolman, S.A. de C.V. | 10,287 | - | - |
| Aptiv Electrical Centers (Shanghai) CO., LTD. | - | 68,357 | - |
| Comunicación Celular, S.A. de C.V. | - | 30,804 | - |
| Servicios de Comunicaciones de Honduras, S.A. de C.V. | - | 12,639 | - |
| Teléfonos de México, S.A. de C.V. | - | 11,547 | 18,015 |
| Bajasur, S.A. de C.V. | - | 10,079 | 22,214 |
| Inversora Bursátil, S. A. de C. V. | - | 7,595 | 13,956 |
| Consorcio Tramo Dos, S. A. de C. V. | - | 6,099 | 21,607 |
| Sociedad Financiera Inbursa, S.A. de C.V., SOFOM, E.R. | - | 1,462 | 12,134 |
| Consorcio Ecuatoriano de Telecomunicaciones, S. A. | - | - | 67 |
| Grupo Telvista, S.A. de C.V. | - | - | 3,013 |
| Triara.COM. | - | - | 790 |
| Fundación Carlos Slim, A. C. | - | - | 34 |
| AMX Contenido, S. A. de C. V. | - | - | 835 |
| Others | 106,762 | 82,276 | 57,276 |
| $ 2,199,077 | $ 2,283,382 | $ 1,662,115 | |
- Borrowings from financial institutions includes balances with Banco Inbursa, S. A. of $18,269,577 as of December 31, 2025, accruing a fixed interest of 8.60%, $21,940,967 as of December 31, 2024, accruing a fixed interest of 9.15% and $13,908,738 as of December 31, 2023, which caused a fixed interest of 13.01%.
- Due to related parties includes advances from customers of $70,078, $121,545 and $83,049 as of December 31, 2025, 2024 and 2023, respectively
- The amounts outstanding are unsecured and will be cash settled. No guarantees have been given or received. No expense has been recognized in the current period or prior periods regarding bad or doubtful debts relating to amounts owed by related parties.
- Transactions with related parties, carried out in the ordinary course of business, were as follows:
| 2025 | 2024 | 2023 | |
|---|---|---|---|
| Sales | $ 26,220,812 | $ 28,947,005 | $ 28,029,079 |
| Interest income | (683,207) | (466,750) | (554,044) |
| Inventories purchased | (1,878,944) | (1,871,067) | (1,195,709) |
| Insurance expenses | (591,273) | (468,110) | (503,174) |
| Lease expenses | (745,150) | (880,667) | (1,051,964) |
| Income for services rendered, net | (312,816) | 1,026,447 | 1,381,828 |
| Other expenses, net | (455,352) | (589,872) | (758,689) |
| Purchases of fixed assets | (28,840) | (26,195) | (714) |
- Transactions with associated entities and joint ventures, carried out in the ordinary course of business, were as follows:
| 2025 | 2024 | 2023 | |
|---|---|---|---|
| Sales | $ 113,281 | $ 80,235 | $ 76,074 |
| (Expense) income services, net | 86 | (1,157) | 186 |
| Inventories purchases | (5,079) | - | (7,914) |
| Lease expenses | - | (4,199) | (3,988) |
| Other expenses, net | (22) | - | (580) |
27. Income
| 2025 | 2024 | 2023 | |
|---|---|---|---|
| Net sales: | $ 148,799,461 | $ 142,515,281 | $ 134,357,757 |
| Sale of goods | 28,526,816 | 41,230,505 | 43,314,640 |
| Construction | 2,641,958 | 2,399,660 | 4,150,532 |
| Interests | 6,391,864 | 6,607,968 | 6,582,767 |
| Services | 3,663,930 | 3,639,462 | 3,428,351 |
| Rentals | 1,331,946 | 1,331,947 | 1,331,948 |
| Dividends | 270,625 | 309,982 | 248,370 |
| Others | |||
| Total | $ 191,626,600 | $ 198,034,805 | $ 193,414,365 |
28. Cost and expenses analyzed by nature
| 2025 | ||||
|---|---|---|---|---|
| Concept | Cost of sales | Sales expenses | Administrative expenses | Total costs and expenses |
| Wages and salaries | $ 11,349,363 | $ 6,915,194 | $ 3,491,686 | $ 21,756,243 |
| Employee benefits | 1,254,296 | 3,331,045 | 608,147 | 5,193,488 |
| Raw materials | 47,589,302 | - | - | 47,589,302 |
| Manufacturing expenses | 10,293,359 | - | 563 | 10,293,922 |
| Finished products | 68,974,361 | - | - | 68,974,361 |
| Depreciation | 4,177,423 | 1,067,497 | 142,008 | 5,386,928 |
| Amortization | 222,909 | 12,658 | 108,905 | 344,472 |
| Depreciation of right-of-use assets | 223,230 | 933,019 | 186,702 | 1,342,951 |
| Advertising | - | 733,793 | 44,656 | 778,449 |
| Insurance | 190,137 | 182,819 | 115,963 | 488,919 |
| Freight | - | 795,186 | 92,993 | 888,179 |
| Allowance for doubtful accounts | 3,826 | 20,055 | 1,227,880 | 1,251,761 |
| Royalties | - | 323,910 | - | 323,910 |
| Fees | 29,758 | 53,594 | 185,771 | 269,123 |
| Maintenance | 313,782 | 1,344,639 | 115,717 | 1,774,138 |
| Plant costs | 14,966 | - | 706,728 | 721,694 |
| Security services | 26,216 | 57,987 | 76,835 | 161,038 |
| Lease | 1,576,533 | 177 | 24,941 | 1,601,651 |
| Telephone | 1,947 | 104,078 | 53,275 | 159,300 |
| Electricity | 5,688 | 644,977 | 11,483 | 662,148 |
| Credit card fees | - | 560,390 | 77,270 | 637,660 |
| Other | 264,294 | 2,067,793 | 1,006,551 | 3,338,638 |
| Total | $ 146,511,390 | $ 19,148,811 | $ 8,278,074 | $ 173,938,275 |
| 2024 | ||||
|---|---|---|---|---|
| Concept | Cost of sales | Sales expenses | Administrative expenses | Total costs and expenses |
| Wages and salaries | $ 11,553,291 | $ 6,678,333 | $ 3,046,925 | $ 21,278,549 |
| Employee benefits | 1,231,597 | 3,159,959 | 498,192 | 4,889,748 |
| Raw materials | 45,785,488 | - | - | 45,785,488 |
| Manufacturing expenses | 11,138,452 | - | 14,602 | 11,153,054 |
| Finished products | 71,317,998 | - | - | 71,317,998 |
| Depreciation | 3,364,420 | 1,011,517 | 108,344 | 4,484,281 |
| Amortization | 256,375 | 12,908 | 99,646 | 368,929 |
| Depreciation of right-of-use assets | 919,025 | 920,536 | 134,342 | 1,973,903 |
| Advertising | - | 759,090 | - | 759,090 |
| Insurance | 119,817 | 182,357 | 115,831 | 418,005 |
| Freight | - | 899,099 | 2,380 | 901,479 |
| Allowance for doubtful accounts | 696 | 7,061 | 748,433 | 756,190 |
| Royalties | - | 325,570 | - | 325,570 |
| Fees | 2,383 | 52,376 | 153,473 | 208,232 |
| Maintenance | 539,726 | 1,332,670 | 224,941 | 2,097,337 |
| Plant costs | - | - | 607,683 | 607,683 |
| Security services | 23,733 | 62,489 | 55,509 | 141,731 |
| Lease | 2,402,038 | 164 | 6,061 | 2,408,263 |
| Telephone | 410 | 92,760 | 80,863 | 174,033 |
| Electricity | 4,744 | 666,530 | 10,661 | 681,935 |
| Credit card fees | - | 553,876 | 54,213 | 608,089 |
| Other | 108,292 | 1,743,761 | 749,287 | 2,601,340 |
| Total | $ 148,768,485 | $ 18,461,056 | $ 6,711,386 | $ 173,940,927 |
| 2023 | ||||
|---|---|---|---|---|
| Concept | Cost of sales | Sales expenses | Administrative expenses | Total costs and expenses |
| Wages and salaries | $ 11,117,902 | $ 5,953,058 | $ 2,805,468 | $ 19,876,428 |
| Employee benefits | 909,198 | 2,758,658 | 454,907 | 4,122,763 |
| Raw materials | 44,675,171 | - | - | 44,675,171 |
| Manufacturing expenses | 10,922,055 | - | 16,710 | 10,938,765 |
| Finished products | 67,459,355 | - | - | 67,459,355 |
| Depreciation | 2,667,830 | 921,539 | 103,306 | 3,692,675 |
| Amortization | 122,900 | 13,727 | 92,807 | 229,434 |
| Depreciation of right-of-use assets | 366,368 | 909,718 | 109,434 | 1,385,520 |
| Advertising | - | 800,031 | - | 800,031 |
| Insurance | 80,813 | 207,276 | 122,464 | 410,553 |
| Freight | - | 718,708 | - | 718,708 |
| Allowance for doubtful accounts | - | 12,041 | 2,781,541 | 2,793,582 |
| Royalties | - | 339,040 | - | 339,040 |
| Fees | 1,883 | 51,954 | 168,792 | 222,629 |
| Maintenance | 798,301 | 1,153,599 | 204,414 | 2,156,314 |
| Plant costs | - | 227 | 672,262 | 672,489 |
| Security services | 22,518 | 69,951 | 54,156 | 146,625 |
| Lease | 2,051,891 | 171 | 7,345 | 2,059,407 |
| Telephone | 409 | 90,512 | 92,937 | 183,858 |
| Electricity | 4,561 | 652,930 | 10,422 | 667,913 |
| Credit card fees | - | 506,856 | 66,178 | 573,034 |
| Other | 98,494 | 1,651,545 | 542,238 | 2,292,277 |
| Total | $ 141,299,649 | $ 16,811,541 | $ 8,305,381 | $ 166,416,571 |
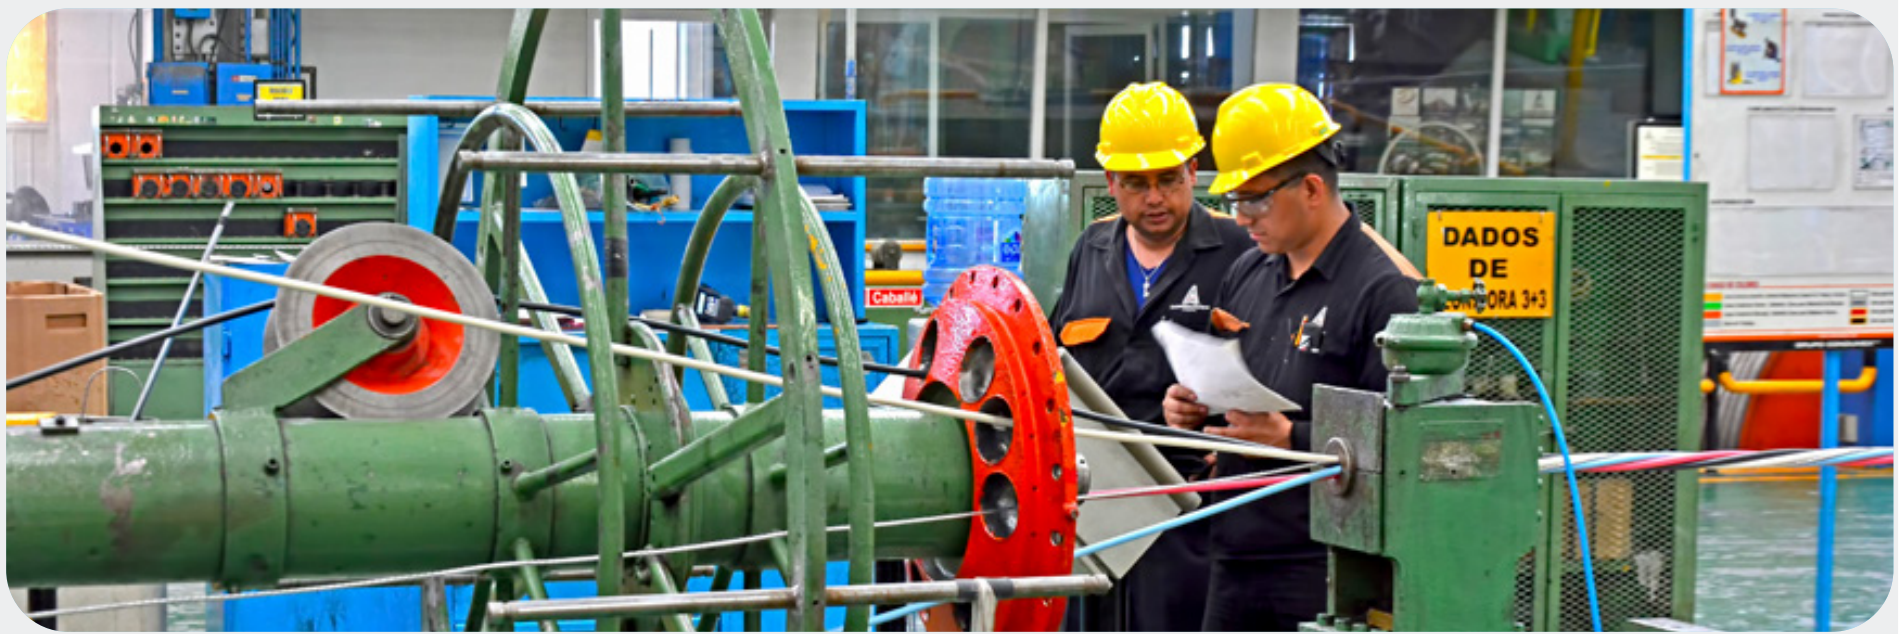
29. Other (income) expenses – net
| 2025 | 2024 | 2023 | |
|---|---|---|---|
| Loss (gain) in sales of materials and waste | $ 202,125 | $ 162,029 | $ 175,549 |
| Loss (gain) on sales of property, plant and equipment | 1,571 | 4,112 | 1,903 |
| Revaluation of investment property revaluation | (411,656) | (69,103) | (170,601) |
| Liabilities and provisions cancellation | (32,068) | (365,238) | (302,783) |
| Net effect of sale of permanent investments (See Note 30) | (2,270,761) | - | - |
| Cancellation of IFRS 16 effect | (207,980) | - | - |
| Rehabilitation expenses Line 12 | 45,864 | 236,959 | 1,243,008 |
| Loss on Sanborns fixed asset disposals | 88,129 | 56,480 | 8,360 |
| Impairment of property, plant and equipment | 1,503,247 | (16,750) | 127,169 |
| Environmental remediation | 2,884 | (3,426) | 1,639 |
| Other expenses, net | (183,110) | (164,583) | (235,917) |
| $ (1,261,755) | $ (159,530) | $ 848,327 |
30. Discontinued operations
As of December 31, 2025, 2024, and 2023, discontinued operations were primarily generated by Giant Cement Holding, Inc., a subsidiary of Fortaleza Materiales, S.A.P.I. de C.V., which is mentioned in Note 2b, as follows:
| 2025 | 2024 | 2023 | |
|---|---|---|---|
| Income | $ 1,144,258 | $ 4,948,615 | $ 5,040,944 |
| Cost of sales | 1,104,177 | 4,158,463 | 4,727,167 |
| Operating expenses | 190,585 | 615,626 | 624,884 |
| Other income (expenses) net | 314 | (31,616) | (645,846) |
| Comprehensive financing result | (10,849) | (10,878) | (32,086) |
| Participation in the results of associates | 82,890 | 115 | - |
| Income taxes. | (832,655) | 14,518 | (300,337) |
| Profit (loss) from discontinued operations. | $ 754,506 | $ 117,629 | $ (688,702) |
31. Income taxes
The Entity is subject to ISR. Under the ISR Law, the rate for 2025, 2024 and 2023 was 30% and will continue for the years thereafter. The applicable ISR rates in the countries where the Entity’s main foreign subsidiaries operate are, United States of North America with rates 21% for 2025, 2024 and 2023 and Brazil with the 34% rate, applicable for the three years. The Entity with only its Mexican subsidiaries incurred ISR on a consolidated basis until 2013. As the ISR Law applicable as of December 31, 2013 was superseded (2014 Law), the tax consolidation regime was eliminated, and the Entity and its subsidiaries have the obligation to pay the deferred income tax calculated as of that date over a 10-year period beginning in 2014, as illustrated below.
At the same time the tax consolidation regime was repealed by the 2014 Law, an option was established, which allows groups of companies to determine a joint calculation of ISR (tax integration regime). The new regime allows groups of consolidated companies that share common direct or indirect ownership of more than 80%, certain benefits in the tax payment (when the group of companies include both profit and loss entities in the same period), which can be deferred over three years and reported, as updated, at the filing date of the tax declaration corresponding to the tax year following the completion of the aforementioned three-year period.
As of 2014, Grupo Carso has been authorized by the Ministry of Finance and Public Credit to prepare its declarations to go based on the tax integration regime, the entity opted to disincorporate from said tax regime as of January 2023.
In accordance with subparagraph d) of section XV of the ninth transitory article of the 2014 Law, and because the Entity as of December 31, 2013 had the status of controller and on that date was subject to the payment scheme contained in the section VI of the fourth article of the transitory provisions of the Income Tax Law published in the official gazette of the federation on December 7, 2009, or article 70-A of the 2014 Income Tax Law that was repealed, you must continue paying the tax which differed due to tax consolidation in 2007 and prior years in accordance with the aforementioned provisions, until its payment was completed.
- Income taxes (benefit) expenses are as follows:
| 2025 | 2024 | 2023 | |
|---|---|---|---|
| ISR: | |||
| Current | $ 4,302,092 | $ 5,187,615 | $ 5,466,537 |
| Deferred | (1,912,342) | 1,714,551 | 580,630 |
| $ 2,389,750 | $ 6,902,166 | $ 6,047,167 | |
- The main items that originate the balance of the deferred income tax liability (asset) as of December 31, are:
| 2025 | 2024 | 2023 | |
|---|---|---|---|
| ISR deferred (asset) liability: | |||
| Property, plant and equipment | $ 3,404,165 | $ 4,033,941 | $ 589,001 |
| Inventories | 230,405 | (157,278) | (640,093) |
| Leased assets | 5,079,615 | 5,782,198 | 4,815,897 |
| Brands | 92,836 | 92,836 | 92,836 |
| Advances from customers | (972,402) | (783,819) | (926,660) |
| Investment in associated entities | 4,628,893 | 4,306,634 | 5,236,623 |
| Metals swaps and forwards | 1,108 | (2,927) | 161,150 |
| Revenues and costs by percentage-of-completion method | 25,862 | 914,827 | 804,330 |
| Allowances for assets and reserves for liabilities | (719,292) | (926,068) | (688,098) |
| Others | (523,762) | (1,154,264) | (526,730) |
| Deferred ISR on temporary differences | 11,247,428 | 12,106,080 | 8,918,256 |
| Effect of tax loss carryforwards | (8,114,196) | (7,279,462) | (4,747,496) |
| Deferred ISR payment (long-term CUFINRE) | 2,124 | 2,048 | 1,965 |
| 3,135,356 | 4,828,666 | 4,172,725 | |
| Total deferred tax asset | 7,797,736 | 7,282,843 | 6,775,088 |
| Total deferred tax liability | $ 10,933,092 | $ 12,111,509 | $ 10,947,813 |
The movements of deferred tax (asset) liabilities during the year are as follows:
| 2025 | 2024 | 2023 | |
|---|---|---|---|
| Opening balance | $ 4,828,666 | $ 4,172,725 | $ 3,868,151 |
| Income tax applied to results | (1,912,342) | 1,714,551 | 580,630 |
| Recognized in other comprehensive income | 219,032 | (1,157,977) | 24,282 |
| Deferred income tax generated from the asset held for sale | - | 675,038 | (300,338) |
| Business acquisition | - | (575,671) | - |
| Closing balance | $ 3,135,356 | $ 4,828,666 | $ 4,172,725 |
- Reconciliation of the statutory and effective ISR rates expressed as a percentage of income before taxes on income, is as follows:
| 2025 | 2024 | 2023 | |
|---|---|---|---|
| Statutory rate | 30 | 30 | 30 |
| Add (less) the effect of permanent differences - | |||
| Non-deductible expenses | 4 | 3 | 4 |
| Effects of inflation | (2) | (2) | (2) |
| Effect of tax loss carryforwards from foreign operations | (8) | (9) | (10) |
| Participation in results of associated entities and joint ventures | (2) | (3) | (2) |
| Others | (5) | 10 | 9 |
| Effective rate | 17 | 29 | 29 |
- Benefits of restated tax loss carryforwards, for which a deferred income tax asset has been recognized, may be recovered if certain requirements are fulfilled. Their maturities and restated amounts at December 31, 2025 are as follows:
| Year of expiration | Tax loss carryforwards |
|---|---|
| 2026 | $ 3,022,997 |
| 2027 | 181,780 |
| 2028 and thereafter | 20,043,434 |
| 23,248,211 | |
| Foreign subsidiaries tax loss carryforwards without expiration term | 4,527,740 |
| Total | $ 27,775,951 |
- Tax integration:
The Entity opted to disincorporate from this new regime, therefore the ISR for the years 2021, 2020, 2019 and 2018 whose amounts are $620,057; $328,344; $98,435 and $204,185 respectively, they were informed in January 2023.
32. Commitments
-
Commercial group:
- As of December 31, 2025, there are contracts entered into with suppliers for the remodeling and construction of some of their stores. The amount of the commitments contracted for this concept amounts to approximately $258,873.
- In December 2010, Sears Operadora México, S. A. de C. V. (formerly Sears Roebuck de México, S. A. de C. V.) (Sears) and Sears Roebuck and Co. (Sears USA) signed an agreement, through which they have decided to extend in the same terms as they were, the Trademark Use License Agreement and the Merchandise Sales and Advisory contracts governing the business relationship between them, which provides for the payment of 1% by Sears to Sears USA on the income from the sale merchandise, through which it is allowed to use Sears name both in its business name and in its stores, as well as the exploitation of trademarks owned by Sears Roebuck and Co. The agreement will be in force until 30 September 2017, but contemplates the existence of an extension of seven additional years under the same conditions, unless someone one decides not to extend it, notifying the other party two years in advance. On 30 September 2017, neither party notified the other of the decision to terminate the Agreement, so it was automatically extended for an additional 7 years respecting the initial terms of the agreement. As of December 31, 2025, Sears is in the process of negotiating a new extension period.
-
Infrastructure and Construction and Industrial:
- In October 2025, Operadora Cicsa, in conjunction with FCC Construcción, S.A. de C.V., won the bid for the “SaltilloMonterrey Passenger Train Construction” project, a 111 km section. The project, valued at $31,843,777 pesos (including 16% VAT), began on December 31, 2025.
- In September 2025, GSM-Bronco and MX DLTA NRG 1 signed a contract with Petróleos Mexicanos (Pemex) for drilling and well completion work in the Ixachi field and to perform expansion services for two macro-wells, for a total of up to US$1,991,180. The service execution period will be 1,096 days, starting from the issuance and notification of the first Work Order, and will conclude once Pemex has paid for all services rendered. As of December 31, 2025, 4% of the work had been completed.
- In April 2025, GSM-Bronco signed a contract with the National Institute of Electricity and Clean Energy for geothermal well drilling services, for a minimum amount of US$45,141; the term of the contract will be 435 calendar days starting on April 11, 2025 and ending on June 19, 2026, as of December 31, 2025 there is a progress of 17%.
- In July 2024, GSM-Bronco and Operadora Cicsa signed a contract with PEP for comprehensive services for the development, extraction, and production of hydrocarbons at Lakach. The remuneration will be subject to the following: The Service Provider (GSM and OCI) will receive compensation equivalent to a percentage of the Cash Flow Fund (FED). This compensation constitutes the payment obligation to be made by PEP for the provision of services, will be paid monthly, and according to the payment mechanism provided in the contract. The contract term will be 6,403 calendar days, starting on June 25, 2024, and ending on January 4, 2042. As of December 31, 2025, the work is in the transition and planning period.
- In September 2021, GSM-Bronco and Canamex Energy Holdings, S.A.P.I. de C.V. received an international electronic restricted invitation procedure from PEP for a turnkey contract for drilling and completion work on development wells for PEP’s onshore fields, for a minimum amount of US $196,050. The work began in September 2021, and as of December 31, 2025, the work under this contract has been completed, and the agreement to extend the amounts and execution periods of the contract is in the process of being signed.
- In May 2020, the Federal Government entered into a contract with Operadora and FCC Construcción, S.A. de C.V. for the development of the executive project, supply of materials and construction, as well as track maintenance consisting of infrastructure inspections, actions on the infrastructure, track, diversion, and adherence to the quality standards for maintenance of the Maya Train railway for a period of 5 years on the sections between Escárcega station (PK 228+000) and Calkiní station (PK 463+000), totaling 235 km. Operadora held a 50% stake, for an original contract amount of $15,994,602 and a completion date of July 2023. On August 25, 2023, an extension to the execution period was agreed upon for items not included in the original contract catalog, and the railway was completed on December 9, 2023. The completion of peripheral works or activities such as: Archaeological Zones, CATVIS and perimeter containment, was completed by the end of December 2024; therefore, the maintenance of railway lines will conclude in September 2029. In March 2025, the client reported the early cancellation of the contract
- Construction of the 169-kilometer Mitla-Tehuantepec highway for $9,318,200, for which a consortium was created in which Operadora participated with 40%. In June 2019, the concessionaire reported the early termination of the contract with the consortium, which was 68% complete, at the same time, the concessionaire assigned the project directly to Operadora for the conclusion of the works for a value of $5,905,000 and during 2023 the originally contracted works were concluded. however, work outside the contract instructed by the client continued to be carried out, concluding in May 2025.
- In the last quarter of 2023, the Polanco Pavilion project was signed for an amount of $2,700,000, with a completion date in the last quarter of 2025. As of December 31, 2025, approximately 47% progress has been made.
- During 2022, contracts were signed for the construction of Star Médica in Interlomas, Puebla, Polanco and León, for a total amount of $4,327,000, with completion during 2024 and 2025, as of December 31, 2025, there is an approximate progress of 54%. In the last quarter of 2023, Tijuana, Inbursa and Carso 3 offices were signed, for a total amount of $3,002,000 with completion during 2025 and 2026, as of December 31, 2025, there is an approximate progress of 47%.
- During the last quarter of 2024, a contract was signed for the construction of the Centauro del Norte Gas Pipeline, the characteristics of the project consist of the installation of a 36” diameter pipe, with a total length of 442 kilometers, which will be divided into 3 phases, between the states of Mexicali Baja California and San Luis Rio Colorado Sonora, this work will be built in conjunction with our part related to FCC Industrial, the value of the contract for CICSA in its first phase is $47,850 thousand dollars. As of December 31, 2025, there is an approximate progress of 32%.
The following reported figures include works carried out directly by CICSA and by Operadora CICSA, which among its main projects have:
As of December 31, 2025, 2024 and 2023, the Entity signed contracts and work orders with related parties in Mexico and Latin America, for total amounts of $8,229,898, $7,864,759 and $10,253,736; as well as USD $376,087, USD $315,158 and USD $356,992, respectively. The contracts include professional services for the construction and modernization of copper cabling networks (pairs) and external plant fiber optics, as well as for the construction of ductwork and installation of fiber optics, public works, and connections. Most of the contracted projects are estimated to be completed during 2026.
33. Contingencies
- Retail sector:
As of the date of these consolidated financial statements, the Entity has legal proceedings in process with the competent authorities for diverse reasons, mainly for foreign trade duties, for the recovery of accounts receivable and for labor matters.
The estimated amount of these judgments as of December 31, 2025, 2024, and 2023 is $325,734, $420,244, and $420,423, respectively. Using techniques accepted by IFRS, the provision amounts have been determined to be $145,584, $135,649, and $114,121, which correspond to the provision line item in the consolidated statements of financial position. The Entity has disbursed approximately $82,181, $81,013, and $48,117 for this purpose during fiscal years 2025, 2024, and 2023. While the outcomes of these legal proceedings cannot be predicted with certainty, the Entity’s management does not believe that any legal proceedings will result in unfavorable rulings for the Entity, and that will have an adverse effect on its financial position or operating results.
-
Infrastructure and construction and Industrial sectors:
- The Entity maintains commercial, tax and labor proceedings. These proceedings are generated in the normal course of business and are common in the industries in which the businesses participate, and even when it is possible that some unfavorable failures occur for the Entity, the administration considers that such allegations would not have an adverse material impact in its consolidated financial situation.
- Certain subsidiaries are currently engaged in legal proceedings with the competent authorities for different reasons, primarily taxes and for the collection of non-current accounts receivable. The Entity’s officers and attorneys consider most of these proceedings will resolve favorably. However, any unfavorable verdict will not substantially affect the Entity’s financial position or results of operations.
- As of December 31, 2025, 2024, and 2023, the Entity has contracted bonds, mainly in favor of its clients, for $13,157,303 and $288,171 thousand US dollars, for $17,980,322 and $62,187 thousand US dollars, and for $4,783,535 and $341,711 thousand US dollars, respectively, which were the amounts of liability in force in those periods.
- Performance warranties. In the normal course of operations, the Entity is required to guarantee its obligations, mainly derived from construction contracts by means of letters of credit or bonds, regarding the compliance with contracts or the quality of the developed works.
34. Segment information
Information by operating segment is presented based on the management focus and general information is also presented by geography. The balances with subsidiaries are presented in the column of Holding, others and eliminations.
a.Condensed analytical information by operating segment:

| Consolidated statements of financial position | 2025 | |||||||
|---|---|---|---|---|---|---|---|---|
| Retail | Industrial and manufacturing | Infrastructure and construction | Elementia | Energy | Zamajal | Holding, others and eliminations | Total consolidated | |
| Assets: | ||||||||
| Cash and cash equivalents | $ 9,064,502 | $ 5,560,797 | $ 3,638,914 | $ 6,670,152 | $ 1,650,606 | $ 305,357 | $ (3,293,648) | $ 23,596,680 |
| Accounts and loans receivable | 13,907,692 | 6,095,467 | 17,208,022 | 3,077,963 | 2,805,551 | 7,249,706 | (5,410,118) | 44,934,283 |
| Inventories | 15,345,882 | 6,765,025 | 2,354,161 | 4,793,206 | 42,284 | 25,134 | 1,029 | 29,326,721 |
| Assets held for sale. | - | 93,699 | - | 463,376 | - | - | - | 557,075 |
| Total current assets | 39,565,007 | 21,541,780 | 28,733,721 | 16,021,878 | 5,187,534 | 3,795,121 | (4,032,256) | 110,812,785 |
| Net investment in leased assets | - | - | - | - | 13,967,455 | - | - | 13,967,455 |
| Property, plant and equipment | 10,539,864 | 5,102,801 | 10,062,907 | 21,404,598 | 12,304,534 | 12,094,769 | 22,776 | 71,532,249 |
| Right-of-use assets | 3,381,205 | 396,787 | 615,341 | 552,316 | 23,946 | - | 26,016 | 4,995,611 |
| Other assets | 207,598 | 580,067 | 243,769 | 87,204 | 237,367 | 30,722 | 16,368 | 1,403,095 |
| Total assets | 66,551,293 | 48,240,246 | 35,761,817 | 41,576,808 | 41,922,868 | 20,298,908 | 12,512,704 | 266,864,644 |
| Liabilities: | ||||||||
| Loans payable to financial institutions and current portion of long-term debt | $ 600,000 | $ 6,178 | $ 5,189,474 | $ 5,729,844 | $ 491,145 | $ 2,224,240 | $ 1,152,229 | $ 15,393,110 |
| Current lease liabilities | 1,288,279 | 58,097 | 265,120 | 193,856 | 6,223 | - | (15,037) | 1,796,538 |
| Trade accounts payable | 11,448,471 | 2,198,404 | 2,920,745 | 2,990,559 | 164,173 | 40,227 | (621,263) | 19,141,316 |
| Total current liabilities | 20,039,175 | 5,229,887 | 19,838,689 | 11,892,806 | 1,132,042 | 4,387,353 | (186,441) | 62,333,511 |
| Long-term debt | - | 5,148 | - | 883,982 | 10,451,237 | - | 10,063,492 | 21,403,859 |
| Noncurrent lease liabilities | 2,813,960 | 366,249 | 426,261 | 445,337 | 18,944 | - | 36,136 | 4,106,887 |
| Total liabilities | 24,261,933 | 6,165,816 | 21,028,584 | 15,752,499 | 13,399,847 | 4,387,353 | 14,881,656 | 99,877,688 |
| Consolidated statements of financial position | 2024 | |||||||
|---|---|---|---|---|---|---|---|---|
| Retail | Industrial and manufacturing | Infrastructure and construction | Elementia | Energy | Zamajal | Holding, others and eliminations | Total consolidated | |
| Assets: | ||||||||
| Cash and cash equivalents | $ 7,355,193 | $ 4,840,780 | $ 1,455,546 | $ 2,423,363 | $ 2,051,563 | $ 174,486 | $ (2,059,222) | 16,241,709 |
| Accounts and loans receivable | 14,174,433 | 6,561,854 | 26,685,868 | 3,092,990 | 3,224,850 | 923,638 | (1,408,959) | 53,254,674 |
| Inventories | 16,290,942 | 6,864,410 | 2,174,489 | 5,886,242 | 58,881 | - | 438 | 31,275,402 |
| Assets held for sale | - | 94,262 | - | 10,594,492 | - | - | - | 10,688,754 |
| Total current assets | 39,093,683 | 21,560,515 | 34,606,208 | 22,899,227 | 6,005,421 | 1,649,081 | (3,331,303) | 122,482,832 |
| Net investment in leased assets | - | - | - | - | 15,978,816 | - | - | 15,978,816 |
| Property, plant and equipment | 12,110,052 | 4,318,048 | 9,022,731 | 23,283,862 | 12,708,053 | 10,788,412 | (2,624) | 72,228,534 |
| Right-of-use assets | 3,451,832 | 336,893 | 1,514,321 | 712,333 | 59,100 | 444,290 | (150,347) | 6,368,422 |
| Other assets | 150,153 | 646,450 | 134,289 | 17,627 | - | 65,014 | 23,486 | 1,037,019 |
| Total assets | 65,343,253 | 46,278,298 | 48,442,348 | 50,280,609 | 48,771,937 | 16,914,991 | 4,308,404 | 280,339,840 |
| Liabilities: | ||||||||
| Loans payable to financial institutions and current portion of long-term debt | $ 1,274,000 | $ 6,780 | $ 8,443,459 | $ 2,551,792 | $ 8,556,708 | $ 2,736,221 | $ (11,193,325) | $ 12,375,635 |
| Current lease liabilities | 1,250,056 | 126,717 | 253,534 | 195,960 | 6,115 | 383,316 | (44,014) | 2,171,684 |
| Trade accounts payable | 12,456,580 | 2,223,542 | 3,775,308 | 3,152,001 | 279,590 | 79 | (386,388) | 21,500,712 |
| Liabilities attributable to assets held for sale | - | - | - | 3,603,448 | - | - | - | 3,603,448 |
| Total current liabilities | 21,660,539 | 5,003,084 | 23,038,227 | 13,346,666 | 10,222,444 | 4,589,274 | (12,421,395) | 65,438,839 |
| Long-term debt | - | 11,965 | - | 7,888,895 | 12,817,173 | - | 14,563,492 | 35,281,525 |
| Noncurrent lease liabilities | 2,973,732 | 255,108 | 330,292 | 594,342 | 56,761 | 247,771 | (131,696) | 4,326,310 |
| Total liabilities | 25,854,266 | 5,831,397 | 25,197,887 | 25,030,602 | 24,883,599 | 5,002,710 | 6,523,232 | 118,323,693 |
| Consolidated statements of financial position | 2023 | |||||||
|---|---|---|---|---|---|---|---|---|
| Retail | Industrial and manufacturing | Infrastructure and construction | Elementia | Energy | Zamajal | Holding, others and eliminations | Total consolidated | |
| Assets: | ||||||||
| Cash and cash equivalents | $ 6,209,095 | $ 3,544,537 | $ 1,738,108 | $ 3,753,021 | $ 1,224,811 | $ 1,716,586 | $ (1,839,111) | $ 16,347,047 |
| Accounts and loans receivable | 14,231,083 | 5,441,185 | 24,604,358 | 3,370,481 | 2,577,747 | 8,540 | (1,393,904) | 48,839,490 |
| Inventories | 14,725,274 | 5,916,241 | 1,938,689 | 5,214,962 | 47,564 | - | 494 | 27,843,224 |
| Total current assets | 35,919,428 | 18,171,776 | 37,036,042 | 13,173,806 | 4,424,219 | 1,725,503 | (3,122,967) | 107,327,807 |
| Net investment in leased assets | - | - | - | - | 13,289,011 | - | - | 13,289,011 |
| Property, plant and equipment | 11,838,436 | 3,786,284 | 8,376,224 | 25,496,669 | 9,828,480 | - | (1,792) | 59,324,301 |
| Right-of-use assets | 3,495,971 | 324,008 | 1,484,581 | 794,608 | 33,542 | - | (178,452) | 5,954,258 |
| Other assets | 69,419 | 521,548 | 77,902 | 30,130 | 596 | - | 13,982 | 713,577 |
| Total assets | 62,426,371 | 40,292,615 | 49,855,714 | 44,744,273 | 39,295,618 | 3,891,444 | 9,967,729 | 250,473,764 |
| Liabilities: | ||||||||
| Loans payable to financial institutions and current portion of long-term debt | $ 1,810,000 | $ 79 | $ 15,686,173 | $ 2,446,476 | $ 7,688,463 | $ - | $ (8,534,013) | $ 19,097,178 |
| Current lease liabilities | 1,199,172 | 107,544 | 203,012 | 81,487 | 6,115 | - | (37,903) | 1,559,427 |
| Trade accounts payable | 11,554,318 | 2,036,704 | 2,273,358 | 3,234,053 | 43,300 | - | (487,892) | 18,653,841 |
| Total current liabilities | 21,352,626 | 4,531,248 | 27,586,574 | 9,430,194 | 9,280,764 | 859,462 | (10,007,056) | 63,033,812 |
| Long-term debt | - | - | 451,056 | 11,153,051 | 11,001,530 | - | 4,047,487 | 26,653,124 |
| Noncurrent lease liabilities | 3,044,697 | 254,316 | 267,961 | 728,787 | 30,442 | - | (156,366) | 4,169,837 |
| Total liabilities | 25,602,892 | 5,315,708 | 29,706,805 | 24,478,803 | 21,028,410 | 859,462 | (674,036) | 106,318,044 |
| Consolidated statements of income | 2025 | |||||||
|---|---|---|---|---|---|---|---|---|
| Retail | Industrial and manufacturing | Infrastructure and construction | Elementia | Energy | Zamajal | Holding, others and eliminations | Total consolidated | |
| Net Sales | $ 74,296,425 | $ 51,533,690 | $ 28,479,211 | $ 30,012,769 | $ 3,363,314 | $ 3,647,011 | $ 294,180 | $ 191,626,600 |
| Cost of sales | 49,841,811 | 44,696,766 | 25,552,453 | 22,707,109 | 539,137 | 4,205,208 | (1,031,095) | 146,511,389 |
| Sales expenses | 16,818,744 | 443,866 | 80,877 | 2,263,288 | 296,342 | - | (754,306) | 19,148,811 |
| Administrative expenses | 3,970,948 | 1,899,496 | 1,477,279 | 867,711 | 59,919 | 97,331 | (94,610) | 8,278,074 |
| Employee profit-sharing | 220,746 | 194,448 | 81,132 | 63,199 | 7,468 | - | 28,789 | 595,782 |
| Other (income) expenses - net | (601,511) | (211,247) | 793,626 | (1,919,729) | (75,522) | (198,681) | 951,309 | (1,261,755) |
| Interest expense | 641,712 | 68,284 | 1,139,510 | 970,751 | 1,180,676 | 135,251 | 470,389 | 4,606,573 |
| Interest income | (666,454) | (325,529) | (117,586) | (208,580) | (45,227) | (6,019) | 206,792 | (1,162,603) |
| Exchange gain | (110,384) | (950,191) | (1,076,857) | (560,128) | (483,301) | (202,412) | 184,646 | (3,198,627) |
| Exchange loss | 70,639 | 1,567,332 | 2,037,919 | 1,328,165 | 464,240 | 276,973 | (75,590) | 5,669,678 |
| Effects of Derivative financial instruments | - | - | - | (3,624) | - | - | - | (3,624) |
| Equity in income of associated companies and joint ventures | (502,623) | (2,100,296) | (550,686) | - | (984,610) | 40,930 | 2,634,289 | (1,462,996) |
| Income before income taxes | 4,612,797 | 6,250,761 | (938,456) | 4,504,607 | 2,404,192 | (701,570) | (2,226,434) | 13,905,897 |
| Income taxes | 1,081,660 | 1,122,058 | (195,555) | 657,815 | 221,679 | (724,060) | 226,153 | 2,389,750 |
| Consolidated net income | 3,531,137 | 5,128,703 | (742,901) | 4,601,298 | 2,182,513 | 22,490 | (2,452,587) | 12,270,653 |
| Net income from controlling interest | 3,117,112 | 4,717,298 | (774,542) | 4,195,558 | 2,182,513 | 22,490 | (4,685,844) | 8,774,585 |
| EBITDA (1) | 6,249,439 | 5,146,606 | 1,425,428 | 8,255,068 | 2,965,420 | 414,206 | 2,132,688 | 26,588,855 |
| Depreciation and amortization | 2,221,875 | 762,752 | 951,549 | 1,823,986 | 429,450 | 871,053 | 13,685 | 7,074,350 |
| Consolidated statements of income | 2024 | |||||||
|---|---|---|---|---|---|---|---|---|
| Retail | Industrial and manufacturing | Infrastructure and construction | Elementia | Energy | Zamajal | Holding, others and eliminations | Total consolidated | |
| Net Sales | $ 73,353,031 | $ 48,786,772 | $ 42,504,591 | $ 29,315,589 | $ 3,354,824 | $ 939,994 | $ (219,996) | $ 198,034,805 |
| Cost of sales | 49,163,025 | 41,693,175 | 35,326,693 | 21,160,716 | 486,307 | 1,553,094 | (614,525) | 148,768,485 |
| Sales expenses | 16,257,306 | 396,551 | 2,281 | 2,153,678 | 246,440 | - | (595,200) | 18,461,056 |
| Administrative expenses | 3,234,260 | 1,418,907 | 1,322,558 | 973,468 | 68,914 | 50,907 | (357,628) | 6,711,386 |
| Employee profit-sharing | 248,940 | 229,472 | 130,507 | 110,544 | - | - | 3,580 | 723,043 |
| Other (income) expenses - net | (394,823) | (144,836) | 541,939 | (110,920) | 13,498 | (63,323) | (1,055) | (159,520) |
| Interest expense | 790,505 | 70,354 | 1,807,731 | 1,648,833 | 1,639,950 | 147,053 | 148,288 | 6,252,714 |
| Interest income | (647,212) | (313,898) | (175,605) | (156,155) | (56,117) | (72,919) | (172,175) | (1,594,081) |
| Exchange gain | (100,800) | (1,919,332) | (1,644,270) | (1,519,086) | (187,738) | 300,182 | (3,096,679) | (8,167,723) |
| Exchange loss | 215,686 | 1,175,289 | 1,097,324 | 760,878 | 740,582 | (211,064) | 1,772,805 | 5,551,500 |
| Effects of Derivative financial instruments | - | - | (2,414) | (8,052) | (697,836) | 95,755 | (104,693) | (717,240) |
| Equity in income of associated companies and joint ventures | (480,776) | (1,526,455) | (31,666) | - | (891,566) | 112,304 | 1,510,576 | (1,307,583) |
| Income before income taxes | 5,066,920 | 7,707,545 | 4,129,513 | 4,301,685 | 1,992,390 | (971,995) | 1,286,710 | 23,512,768 |
| Income taxes | 1,141,646 | 1,763,580 | 1,335,949 | 1,688,278 | 825,457 | 414,102 | (266,845) | 6,902,167 |
| Consolidated net income | 3,925,274 | 5,943,965 | 2,793,564 | 2,731,036 | 1,166,933 | (1,386,097) | 1,553,555 | 16,728,230 |
| Net income from controlling interest | 3,569,403 | 5,342,065 | 2,777,698 | 2,684,332 | 1,166,933 | (1,386,097) | 302,639 | 14,456,973 |
| EBITDA (1) | 7,024,222 | 5,908,733 | 6,163,403 | 6,687,730 | 2,920,944 | 330,236 | 1,298,350 | 30,333,618 |
| Depreciation and amortization | 2,102,984 | 786,295 | 978,807 | 1,655,540 | 381,279 | 949,058 | (26,850) | 6,827,113 |
| Consolidated statements of income | 2023 | |||||||
|---|---|---|---|---|---|---|---|---|
| Retail | Industrial and manufacturing | Infrastructure and construction | Elementia | Energy | Zamajal | Holding, others and eliminations | Total consolidated | |
| Net Sales | $ 73,326,668 | $ 44,619,685 | $ 45,009,965 | $ 27,220,639 | $ 3,476,672 | $ - | $ (239,264) | $ 193,414,365 |
| Cost of sales | 48,072,616 | 37,643,433 | 35,588,795 | 20,046,484 | 506,239 | - | (557,918) | 141,299,649 |
| Sales expenses | 15,025,045 | 381,945 | 7,371 | 1,754,141 | 217,753 | - | (574,714) | 16,811,541 |
| Administrative expenses | 5,127,342 | 1,317,043 | 1,338,273 | 934,104 | 83,138 | 2,778 | (497,297) | 8,305,381 |
| Employee profit-sharing | 473,555 | 169,832 | 72,491 | 79,948 | - | - | 3,289 | 799,115 |
| Other (income) expenses - net | (309,903) | (258,282) | 1,459,236 | (18,260) | (4,142) | - | (20,322) | 848,327 |
| Interest expense | 723,928 | 56,303 | 1,233,512 | 2,022,385 | 1,568,646 | 1 | 188,113 | 5,792,888 |
| Interest income | (658,750) | (659,530) | (232,689) | (131,212) | (203,875) | (25,705) | 164,258 | (1,747,503) |
| Exchange gain | (145,506) | (1,159,245) | (1,277,936) | 184,028 | (608,996) | (58,966) | (507,487) | (3,574,108) |
| Exchange loss | 89,903 | 1,960,238 | 1,514,115 | 723,364 | 261,695 | 35,025 | 1,019,352 | 5,603,692 |
| Effects of Derivative financial instruments | - | - | - | - | - | - | (78,093) | (78,093) |
| Equity in income of associated companies and joint ventures | (376,132) | (222,115) | (90,554) | - | (842,386) | (3,774) | 267,253 | (1,267,708) |
| Income before income taxes | 5,304,570 | 5,390,063 | 5,397,352 | 1,625,657 | 2,498,599 | 50,641 | 354,302 | 20,621,184 |
| Income taxes | 1,270,024 | 1,357,355 | 1,592,228 | 1,340,594 | 451,629 | 14,674 | 20,662 | 6,047,166 |
| Consolidated net income | 4,034,546 | 4,032,708 | 3,805,123 | 285,063 | 2,046,971 | 35,967 | (355,062) | 13,885,316 |
| Net income from controlling interest | 3,712,511 | 3,682,962 | 3,782,195 | 794,783 | 2,046,971 | 35,967 | (536,005) | 13,519,384 |
| EBITDA (1) | 7,110,926 | 5,842,446 | 7,451,680 | 5,913,116 | 3,007,109 | (2,778) | 1,351,883 | 30,674,382 |
| Depreciation and amortization | 1,992,405 | 620,902 | 898,073 | 1,499,007 | 333,425 | - | (36,183) | 5,307,629 |

(1) Reconciliation of EBITDA
| 2025 | 2024 | 2023 | |
|---|---|---|---|
| Income before income taxes | $ 13,905,897 | $ 23,512,768 | $ 20,621,184 |
| Depreciation and amortization | 7,074,351 | 6,827,113 | 5,307,629 |
| Interest income | (1,162,603) | (1,594,081) | (1,747,503) |
| Interest expense | 4,606,573 | 6,252,714 | 5,792,888 |
| Exchange loss (gain) | 2,471,051 | (2,616,223) | 2,029,584 |
| Surplus from appraisals of shopping centers | (411,537) | (69,103) | (170,601) |
| Impairment of property, plant and equipment and of exploration expenses | 1,503,247 | (16,750) | 117,361 |
| Environmental remediation | 2,884 | 3,426 | (1,639) |
| Effects of valuation of derivative financial instruments valuation | |||
| Equity in income of associated entities and | (3,624) | (717,240) | (78,093) |
| joint ventures | (1,462,996) | (1,307,583) | (1,267,708) |
| Rethinking of Employee retirement benefits | 113,152 | 100,400 | 88,971 |
| Portfolio Impairment | (19,965) | (18,138) | 9,808 |
| Other items | (27,575) | (23,685) | (27,499) |
| EBITDA | $ 26,588,855 | $ 30,333,618 | $ 30,674,382 |
Grupo Carso’s EBITDA for the year ended December 31, 2025 increased by 0.12%.
Cash flows from operating activities:
| 2025 | 2024 | 2023 | |
|---|---|---|---|
| Retail | $ 5,069,557 | $ 5,439,812 | $ 4,882,198 |
| Industrial | 4,705,910 | 3,049,878 | 4,383,130 |
| Infrastructure and construction | 7,578,869 | 10,658,554 | (6,124,115) |
| Elementia | 7,131,827 | 5,424,445 | 4,578,444 |
| Carso Energy | (2,012,867) | 3,117,450 | 3,761,017 |
| Zamajal | (1,579,480) | (1,115,930) | 822,777 |
| Others and eliminations | 3,418,101 | (1,554,204) | 314,540 |
| Total consolidated | $ 24,311,917 | $ 25,020,005 | $ 12,617,991 |
Cash flows from investing activities:
| 2025 | 2024 | 2023 | |
|---|---|---|---|
| Retail | $ (295,924) | $ (914,937) | $ (571,789) |
| Industrial | (791,272) | (367,924) | (47,208) |
| Infrastructure and construction | (896,653) | (1,324,338) | (987,785) |
| Elementia | 3,692,567 | (1,074,583) | 519,458 |
| Carso Energy | 6,369,023 | 96,542 | 186,289 |
| Zamajal | (2,050,338) | 11,865,313 | (2,116,024) |
| Others and eliminations | (6,044,222) | (22,476,232) | 2,509,042 |
| Total consolidated | $ (16,819) | $ (14,196,159) | $ (508,017) |
Cash flows from financing activities:
| 2025 | 2024 | 2023 | |
|---|---|---|---|
| Retail | $ (3,064,324) | $ (3,378,777) | $ (6,499,464) |
| Industrial | (3,194,060) | (1,479,776) | (7,368,072) |
| Infrastructure and construction | (4,458,784) | (9,723,552) | 7,332,788 |
| Elementia | (7,038,963) | (5,253,902) | (5,474,353) |
| Carso Energy | (1,207,956) | (1,650,406) | (1,584,420) |
| Zamajal | 3,445,595 | (11,115,994) | 2,999,998 |
| Others and eliminations | (5,965,972) | 21,220,611 | 3,958,052 |
| Total consolidated | $ (21,484,464) | $ (11,381,796) | $ (6,635,471) |
- General segment information by geographical area:
The Entity operates in different geographical areas and has distribution channels in Mexico, the United States and other countries through industrial plants, commercial offices or representatives.
The distribution of sales is as follows
| 2025 | % | 2024 | % | 2023 | % | |
|---|---|---|---|---|---|---|
| North America | $ 32,518,310 | 16.97 | $ 31,611,951 | 15.96 | $ 28,429,626 | 14.70 |
| Central and South America and the Caribbean | 17,330,384 | 9.04 | 16,590,901 | 8.38 | 15,345,535 | 7.93 |
| Europa | 1,489,368 | 0.78 | 1,037,686 | 0.52 | 787,942 | 0.41 |
| Rest of the world | 336,291 | 0.18 | 380,368 | 0.19 | 468,931 | 0.24 |
| Total exports and foreign income | 51,674,353 | 26.97 | 49,620,906 | 25.06 | 45,032,034 | 23.28 |
| Mexico | 139,952,247 | 73.03 | 148,413,899 | 74.94 | 148,382,331 | 76.72 |
| Net Sales | $ 191,626,600 | 100 | $ 198,034,805 | 100 | $ 193,414,365 | 100 |
35. Adoption of new and revised Accounting IFRS
- New and amended IFRS® Accounting Standards (“IFRS” or “IAS”) that are mandatory for the current year
In the year, the group has implemented amendments to the IFRS Accounting Standards issued by the International Financial Reporting Standards Board (IASB) that are mandatory for accounting periods beginning on or after January 1, 2025. Its adoption has not had a material impact on the disclosures or amounts reported in these financial statements.
| Amendments to IAS 21 Effects of Changes in Foreign Exchange Rates, entitled Lack of Interchangeability | The group has adopted amendments to IAS 21 for the first time this year. The amendments specify how to assess whether a currency is convertible and how to determine the exchange rate when it is not. |
IFRS Accounting Standards issued that are not yet effective
As of the date of authorization of these financial statements, the Group has not applied the following new and revised IFRS that have been issued, but are not yet effective.
| Amendment to IFRS 9 and IFRS 7 | Changes to the classification and measurement of financial instruments |
| Annual Improvements to IFRS Accounting Standards – Volume 11 | Amendments to IFRS 1 First Adoption of International Financial Reporting Standards, IFRS 7 Financial Instruments: Disclosures and its accompanying Guidance on the Implementation of IFRS 7, IFRS 9 Financial Instruments, IFRS 10 Consolidated Financial Statements and IAS 7 Statement of Cash Flows. |
| Amendments to IFRS 9 and IFRS 7 | Contracts that refer to nature-dependent electricity |
| IFRS 18 | Presentation and disclosure in the financial statements |
| IFRS 19 | Non-Publicly Held Subsidiaries: Disclosures |
The Entity’s management does not expect the adoption of the aforementioned standards to have a material impact on the Entity’s consolidated financial statements in future periods, except as indicated below:
Amendments to IFRS 9 and 7 - amendments to the Classification and Measurement of Financial Instruments
The amendments made to the Amendments to the Classification and Measurement of Financial Instruments (Amendments to IFRS 9 and 7) are as follows:
Derecognition of a financial liability settled by electronic transfer
The amendments allow an entity to consider as settled (and derecognition) a financial liability (or part thereof) that is settled by an electronic payment system, before the settlement date, if certain criteria are met. If an institution chooses to apply this accounting policy, it must do so for all settlements made through the same electronic payment system.
Classification of financial assets
The amendments provide guidance on how an entity should assess whether the contractual cash flows of a financial asset are compatible with a core loan agreement. This is intended to help the entity apply the requirements for assessing the characteristics of contractual cash flows to financial assets with characteristics linked to environmental, social and governance (ESG) factors.
Assets with “non-recourse” characteristics
The amendments broaden the description of the term “nonrecourse”, in particular, by specifying that a financial asset has “non-recourse” characteristics if an entity’s ultimate right to receive cash flows is contractually limited to the cash flows generated by specific assets.
Contractually linked instruments.
The amendments clarify the characteristics of contractually linked instruments that distinguish them from other transactions. Specifically, the amendments highlight that, in this type of instrument, a prioritisation of payments to holders of financial assets using multiple contractually linked instruments (tranches) is established through a cascading payment structure, which generates concentrations of credit risk and a disproportionate distribution of losses among the holders of the different tranches. The amendments also note that not all transactions with multiple debt instruments meet the criteria for transactions with multiple contractually linked instruments. In addition, the amendments clarify that the reference to the instruments in the underlying portfolio may include financial instruments that are not within the scope of the classification requirements.
Information to be disclosed
Investments in equity instruments designated at fair value with a change in comprehensive income (FVTOCI).
The requirements of IFRS 7 are amended to require an entity to disclose the fair value gain or loss presented in other comprehensive income during the period, showing separately the gain or loss at fair value related to the investments derecognized in the period and the gain or loss at fair value related to the investments held at the end of the period.
Contractual clauses that could change the timing or amount of contractual cash flows.
The amendments require an entity to disclose contractual terms that could alter the timing or amount of contractual cash flows upon the occurrence (or non-occurrence) of a contingent event that is not directly related to changes in the basic risks and costs of borrowing. The requirements apply to each financial asset class measured at amortized cost or fair value through comprehensive income (FVTOCI) and to each financial liability class measured at amortized cost.
The amendments enter into force for annual years beginning on or after 1 January 2026, allowing for early application. If an entity chooses to apply these amendments to an earlier period, it must:
- implement all amendments simultaneously and disclose this fact; or
- apply only the amendments to the classification of financial assets for that previous period and disclose this fact.
Amendments should be applied retroactively, in accordance with IAS 8, with specific exceptions.
The entity anticipates that the application of these amendments could have an impact on the group’s consolidated financial statements in future periods.
Annual Improvements to IFRS Accounting Standards — Volume 11
The IASB issued amendments to five IFRS Accounting Standards as part of its annual improvement process.
IFRS 1 First Adoption of International Financial Reporting Standards - Hedge Accounting by a First-Time Adopter
To maintain consistency with the requirements of IFRS 9, paragraphs B5 and B6 of IFRS 1 were amended to refer to the “qualification criteria” for hedge accounting (rather than “conditions”) and to add cross-references to section 6.4.1 of IFRS 9, in order to improve the understanding of IFRS 1.
IFRS 7 Financial Instruments: Disclosures - Gain or Loss on Derecognition
The amendments remove an outdated cross-reference in paragraph B38 of IFRS 7 to a paragraph that had been deleted with the publication of IFRS 13 and harmonize the wording of that paragraph with the language used in IFRS 13.
Guide to the Application of IFRS 7 - Disclosure of the Deferred Difference Between Fair Value and Transaction Price
The amendments update paragraph IG14 of IFRS 7 to make the wording of that paragraph consistent with paragraph 28 of IFRS 7 and to improve the internal consistency of the wording of the example in IFRS 7:IG14.
Guide to the implementation of IFRS 7: Introduction and disclosure of credit risk
The amendments add a statement to IFRS 7:IG1 that clarifies that the guidance does not necessarily illustrate all the requirements of the paragraphs of IFRS 7 referred to. They also simplify the explanation of aspects of the requirements that are not illustrated in IFRS 7:IG20B.
IFRS 9 Financial Instruments: Recognition of Lease Liabilities
The amendments add a cross-reference to IFRS 9:3.3.3 in IFRS 9.2.1(b)(ii) to clarify that, when a lessee determines that a lease liability has been extinguished in accordance with IFRS 9, it must apply IFRS 9:3.3.3 and therefore recognise any resulting gains or losses in the income statement.
IFRS 9 Financial Instruments - Transaction Price
The amendments replace the reference to “your transaction price (as defined in IFRS 15)” in IFRS 9.5.1.3 with “the amount determined through the application of IFRS 15” to resolve the inconsistency between IFRS 9.5.1.3 and the requirements of IFRS 15, which may require an account receivable to be measured at an amount other than the transaction price recognized as income. In addition, the reference to “transaction price” (as defined in IFRS 15) is deleted from Appendix A to IFRS 9.
IFRS 10 Consolidated Financial Statements - Determination of a “de facto agent”
The amendments address the concern that the requirements of IFRS 10:B73-B74 may be contradictory in some cases. IFRS 10:B73 refers to “de facto agents” as parties acting on behalf of the investor and states that the determination of whether other parties are acting as de facto agents requires professional judgment. However, the second sentence of IFRS 10:B74 is more conclusive and states that a party is a de facto agent when those who direct the investor’s activities have the ability to instruct that party to act on behalf of the investor. The amendments update IFRS 10:B74 to use less conclusive language and clarify that the relationship described in IFRS 10:B74 is only an example of a circumstance in which professional judgment is required to determine whether a party is acting as a de facto agent.
IAS 7 Statement of Cash Flows - Cost Method
The amendment replaces the term “cost method” with “at cost” in IAS 7:37, consistent with the removal of the definition of “cost method” from IFRS Accounting Standards.
The amendments are effective for annual years beginning on or after 1 January 2026, allowing for early implementation. An entity should apply the amendments to IFRS 9:2.1(b)(ii) to lease liabilities that expire on or after the beginning of the annual period in which the entity first applies that change. No specific transitional provisions are laid down for the other amendments.
Amendments to IFRS 9 and IFRS 7 - Contracts Referring to Electricity from Renewable Sources
Amendments to IFRS 9 Financial Instruments
The following amendments affect the requirements of IFRS 9:
- The own use requirements of IFRS 9 are amended to include factors that an entity must consider when applying section 2.4 of IFRS 9 to contracts for the purchase and receipt of renewable electricity whose source of production depends on nature; and
- the hedge accounting requirements of IFRS 9 are amended to allow an entity using a renewable electricity contract, dependent on nature, with specific characteristics as a hedging instrument to:
or designate a variable volume of planned electricity transactions as the item covered if the specified criteria are met; or measure the hedged item using the same volume assumptions as those used for the hedging instrument.
Amendments to IFRS 7 Financial Instruments: Disclosures and IFRS 19 Non-Publicly Disclosed Subsidiaries: Disclosing
IFRS 7 and 19 were amended to introduce disclosure requirements on nature-dependent electricity supply contracts with specific characteristics.
The amendments are effective for annual years beginning on or after 1 January 2026, allowing for early implementation. Amendments to the own-use exemption should be applied retroactively in accordance with IAS 8, using the facts and circumstances existing at the date of the initial application. Amendments to the hedge accounting requirements will apply prospectively to the new designated hedge relationships as of the date of initial application.
The entity does not anticipate that the application of these amendments could have an impact on the group’s consolidated financial statements in future years.
IFRS 18 Presentation of Disclosures in the Financial Statements
IFRS 18 replaces IAS 1, keeping many of the requirements of IAS 1 unchanged and supplementing them with new requirements. In addition, some paragraphs of IAS 1 have been moved to IAS 8 and IFRS 7. In addition, the IASB has made minor amendments to IAS 7 and IAS 33 Earnings per Share.
IFRS 18 introduces new requirements for:
- Present specific categories and subtotals defined in the profit and loss statement
- Provide information on management-defined performance measures (MPMs) in the notes to the financial statements.
- Improve aggregation and disaggregation.
An entity is required to apply IFRS 18 for annual reporting years beginning on or after January 1, 2027, with early application permitted. Amendments to IAS 7 and IAS 33, as well as amendments to revised IAS 8 and IFRS 7, become effective when an entity applies IFRS 18. IFRS 18 requires retroactive application with specific transitional provisions.
The administration is carrying out the necessary work for the adoption of the standard.
IFRS 19 Non-Publicly Disclosed Subsidiaries: Disclosing Information
IFRS 19 allows an eligible subsidiary (defined as a subsidiary that has no public liability and has an ultimate or intermediate parent that prepares publicly available consolidated financial statements that comply with IFRS Accounting Standards) to provide reduced information when applying IFRS Accounting Standards in its financial statements.
The new rule is effective for notice periods beginning on or after January 1, 2027, and early enforcement is permitted.
The Entity’s management does not expect IFRS 19 to be applied for purposes of the group’s consolidated financial statements.
The Entity’s management anticipates that the application of these amendments may have an impact on the Group’s consolidated financial statements in future periods if such transactions arise.
36. Material accounting policies
- Statement of compliance - The Entity's consolidated financial statements have been prepared in accordance with IFRS issued by the IASB.
- Going concern - Grupo Carso's consolidated financial statements have been prepared by Management assuming that the Entity will continue to operate as a going concern.
-
Basis of preparation - The Entity's consolidated financial statements have been prepared on the basis of historical cost, except for certain long-term assets and financial instruments that are measured at revalued amounts or at fair value at the end of each period, as explained in the accounting policies below. Consolidated financial statements are prepared in pesos, the legal tender of the United Mexican States and are presented in thousands, except when indicated.
- Historical cost
Historical cost is generally based on the fair value of the consideration given in exchange for goods and services.
- Fair value
Fair value is defined as the price that would be received for selling an asset or that would be paid for transferring or settling a liability in an orderly transaction between market participants at the valuation date, regardless of whether that price is observable or estimated using another valuation technique directly. In estimating the fair value of an asset or liability, the Entity takes into account the characteristics of the asset or liability, whether market participants would take those characteristics when pricing the asset or liability at the measurement date. The fair value for measurement and/or disclosure purposes of these consolidated financial statements is determined in such a manner, with the exception of transactions with share-based payments that are within the scope of IFRS 2, lease transactions that are within the scope of IFRS 16, and valuations that have some similarities to fair value, but it is not a fair value, such as the net realized value of IAS 2 or the value in use of IAS 36.
-
Basis for consolidation of financial statements - Consolidated financial statements include the financial statements of the Entity and those of the direct and indirect subsidiaries in which it has control. Control is gained when Grupo Carso:
- It has power over investment.
- You are exposed, or are entitled to, variable returns from your participation in that entity, and
- It has the ability to affect such returns through its power over the entity in which it invests.
Grupo Carso reevaluates whether or not it has control in an entity if the facts and circumstances indicate that there are changes to one or more of the three elements of control listed above.
Where Grupo Carso has less than a majority of the voting rights of an investee, Grupo Carso has power over the investee when the voting rights are sufficient to give it the practical ability to conduct its relevant activities, unilaterally. Grupo Carso considers all relevant facts and circumstances to assess whether your voting rights in the investee are sufficient to grant you power, including:
- The percentage of Grupo Carso's participation in the voting rights in relation to the percentage and dispersion of the voting rights of the other holders thereof;
- Potential voting rights held by Grupo Carso, by other shareholders or by third parties;
- Rights arising from other contractual agreements, and
- Any additional facts and circumstances that indicate that Grupo Carso has, or does not have, the current capacity to direct the relevant activities at the time decisions are to be made, including shareholder voting trends at previous meetings.
The subsidiaries are consolidated from the date on which control is transferred to Grupo Carso, and are no longer consolidated from the date on which control is lost. Gains and losses of subsidiaries acquired or sold during the year are included in the consolidated statements of income and other comprehensive income from the date Grupo Carso gains control or until the date it is lost, as the case may be.
When necessary, adjustments are made to the financial statements of the subsidiaries to align their accounting policies in accordance with Grupo Carso's accounting policies.
All related assets, liabilities, equity, revenues, expenses and cash flows related to related-party transactions have been completely eliminated in consolidation.
Non-controlling interests in subsidiaries are identified separately from Grupo Carso's capital in them. Non-controlling shareholder interests, which are current ownership interests that entitle their holders to a proportionate share of net assets at the time of liquidation, may initially be measured at fair value or the non-controlling parties' proportionate share of the fair value of the acquired's identifiable network. The choice of the measure is made on an acquisition-by-acquisition basis. Other non-controlling interests are initially measured at fair value. Post-acquisition, the carrying amount of non-controlling interests is the amount of those interests in initial recognition plus the share of non-controlling interests in subsequent changes in capital. Total comprehensive income is attributed to non-controlling interests even if this results in non-controlling interests having a negative balance.
The results of each component of other comprehensive income are attributed to the company's shareholders and non-controlling interests. The total comprehensive income statements of the subsidiaries are attributed to the company's shareholders and non-controlling interests, even if this results in a deficit in non-controlling interests.
Changes in investments in the Entity's subsidiaries that do not result in a loss of control are recorded as equity transactions. The carrying amount of the Entity's investments and non-controlling interests is adjusted to reflect changes in the corresponding investments in subsidiaries. Any difference between the amount by which non-controlling interests are adjusted and the fair value of the consideration paid or received is recognized directly in stockholders' equity and is attributed to the owners of the Entity.
When the Entity loses control of a subsidiary, the gain or loss on disposition is calculated as the difference between (i) the sum of the fair value of the consideration received and the fair value of any retained interest and (ii) the prior carrying amount of the assets (including goodwill) and liabilities of the subsidiary and any non-controlling interest. Amounts previously recognized in other items of comprehensive income relating to the subsidiary are recognized in the same manner as established in the event that the relevant assets or liabilities are available (i.e., they are reclassified to profit or loss or transferred directly to other stockholders' equity items as specified/permitted by applicable IFRS).
The fair value of any investment retained in the subsidiary as of the date control is lost is considered to be the fair value for initial recognition under IAS 39 or, as the case may be, the cost at initial recognition of an investment in an associate or joint venture.
- Financial instruments
Financial assets and liabilities are recognized when the Entity becomes a party to the contractual provisions of the instruments.
Financial assets and liabilities are initially measured at fair value. Transaction costs that are directly attributable to the acquisition or issuance of financial assets and liabilities (other than financial assets at fair value through profit or loss) are added to or reduced from the fair value of the financial assets or liabilities, if any, at initial recognition. Transaction costs directly attributable to the acquisition of financial assets and liabilities at fair value through profit or loss are immediately recognized in profit or loss.
- Financial assets
All regular purchases or sales of financial assets are recognized and derecognized on a trade date. Regular purchases or sales are purchases or sales of financial assets that require the delivery of assets within the period established by regulation or customary market practices.
All financial assets recognized are subsequently measured in their entirety, either at amortized cost or fair value, according to the classification of financial assets.
Classification of financial assets
Debt instruments that meet the following conditions are subsequently measured at amortized cost:
- If the financial asset is held in a business model whose objective is to hold financial assets with the aim of obtaining contractual cash flows; and
- The contractual terms of the financial asset give rise on specific dates to cash flows that are only payments of principal and interest on the principal amount.
Debt instruments that meet the following conditions are subsequently measured at fair value through other comprehensive income:
- The financial asset is held within a business model whose objective is fulfilled by obtaining contractual cash flows and selling financial assets; and
- The contractual terms of the financial asset give rise, on specific dates, to cash flows that are only payments of principal and interest on the outstanding amount of the principal.
By default, all other financial assets are subsequently measured at fair value through profit or loss.
Notwithstanding the foregoing, the Entity may make the following irrevocable election/designation in the initial recognition of a financial asset:
- You may irrevocably elect to present subsequent changes in the fair value of an equity investment in other comprehensive income if certain criteria are met (see (iii) below); and
- It may irrevocably designate a debt instrument that meets the criteria of amortized cost or fair value through other comprehensive income if in doing so it eliminates or significantly reduces an accounting mismatch (see (iv) below).
(i) Amortized Cost and Effective Interest Method
The effective interest method is a method of calculating the amortized cost of a debt instrument and of allocating interest income during the relevant period.
For financial assets that were not purchased or originated by credit-impaired financial assets (e.g., assets that have credit impairment at initial recognition), the effective interest rate is the rate that exactly discounts expected future cash inflows (including all fees and points paid or received that are an integral part of the effective interest rate, transaction costs and other premiums or discounts) excluding expected credit losses, over the expected life of the debt instrument or, where applicable, a shorter period, to the gross carrying amount of the debt instrument at initial recognition. For credit-impaired financial assets purchased or originated, a credit-adjusted effective interest rate is calculated by discounting estimated future cash flows, including expected credit losses, to the amortized cost of the debt instrument at initial recognition.
The amortized cost of a financial asset is the amount at which the financial asset is measured at initial recognition minus principal repayments, plus the amortization accrued using the effective interest method of any difference between that initial amount and the maturity amount, adjusted for any losses. The gross carrying amount of a financial asset is the amortized cost of a financial asset before adjusting for any provisions for losses.
Interest income is recognized using the effective interest effect for debt instruments subsequently measured at amortized cost and fair value through other comprehensive income. For purchased or originated financial assets other than credit impairment financial assets, interest income is calculated by applying the effective interest rate to the gross carrying amount of a financial asset, except for financial assets that have subsequently suffered credit impairment (see below). For financial assets that have subsequently been impaired on credit, interest income is recognized by applying the effective interest rate to the amortized cost of the financial asset. If in subsequent reporting periods the credit risk in the credit-impaired financial instrument improves, so that the financial asset is no longer credit-impaired, interest income is recognized by applying the effective interest rate to the gross carrying amount of the financial asset.
For acquired or originated financial assets that have credit impairment, the Entity recognizes interest income by applying the credit-adjusted effective interest rate to the amortized cost of the financial asset as of its initial recognition. The calculation does not return to the gross basis, even if the credit risk of the financial asset subsequently improves, so that the financial asset no longer has credit impairment.
Interest income is recognized by profit or loss (profit/loss) and is included in the item "Financial income - Interest income".
(ii) Investments in equity designated as Fair Value through other comprehensive income
In initial recognition, the Entity may make an irrevocable election (instrument by instrument) to designate investments in equity instruments at fair value through other comprehensive income. Fair value designation through other comprehensive income is not permitted if the equity investment is held for trading or if it is contingent consideration recognized by an acquirer in a business combination.
Investments in equity instruments at fair value through other comprehensive income are initially measured at fair value plus transaction costs. They are then measured at fair value with gains and losses arising from changes in fair value recognised in other comprehensive income and accumulated in the investment revaluation reserve. Accumulated gain or loss cannot be reclassified to profit or loss on the disposition of capital investments, but is transferred to retained earnings.
Dividends from these investments in equity instruments are recognized as profit or loss in accordance with IFRS 9, unless the dividends clearly represent a recovery of part of the cost of the investment. Dividends are included under "dividends" (Note 27) in profit or loss.
The Entity has designated all investments in equity instruments that are not held for trading at fair value through other comprehensive income in the initial application of IFRS 9.
A financial asset is held for trading if:
- It has been obtained with the main objective of selling in the short term; or
- In the initial recognition, it is part of a portfolio of identified financial instruments that the Entity manages together and has evidence of a recent pattern of obtaining profits in the short term; or
- It is a derivative (except for derivatives that are contractual financial guarantees or an effective hedging instrument).
(iii) Financial Assets at Fair Value through Profit or Loss
Financial assets that do not meet the criteria to be measured at amortized cost or fair value through other comprehensive income (see (i) to (iii) above) are measured at fair value through profit or loss. Specifically:
- Investments in equity instruments are classified for fair value through profit or loss, unless the Entity designates an equity investment that is not held for trading or a contingent consideration arising from a business combination at fair value through other comprehensive results at initial recognition (see (iii) above).
- Debt instruments that do not meet the amortized cost criteria or the fair value criteria through other comprehensive income (see (i) and (ii) above) are classified as fair value through profit or loss. In addition, debt instruments that meet the amortized cost criteria or the fair value through other comprehensive income criteria may be designated as fair value through profit or loss at the time of initial recognition if such designation eliminates or significantly reduces a measurement or recognition inconsistency (referred to as an "accounting disparity") that would arise from the measurement of assets or liabilities or the recognition of gains and losses on them in different bases. The Entity has not designated any debt instruments with fair value through profit or loss.
Financial assets at fair value through other comprehensive income are measured at fair value at the end of each reporting period, with any fair value gain or loss recognized in profit or loss to the extent that they are not part of a designated hedging relationship (see hedge accounting policy). Net gain or loss recognized as profit or loss includes any dividend or interest earned on the financial asset and is included under the heading "other (income) expenses, net" (Note 29). Fair value is determined in the manner described in Note 36(f)(ii)
Foreign exchange gains and losses
The carrying amount of financial assets denominated in a foreign currency is determined in that foreign currency and converted at the exchange rate at the end of each reporting period. Specifically;
- For financial assets measured at amortized cost that are not part of a designated hedging relationship, exchange differences are recognized in profit or loss under "other (income) expenses, net" (Note 29);
- For debt instruments measured at fair value through other comprehensive income that are not part of a designated hedging relationship, the exchange differences in the amortized cost of the debt instrument are recognized in profit or loss under the heading "other (income) expenses, net" (Note 29). Other exchange differences are recognized in other comprehensive income in the investment revaluation reserve;
- For financial assets measured at fair value through profit or loss that are not part of a designated hedging relationship, foreign exchange differences are recognized in profit or loss under "other gains and losses"; and
- For equity instruments measured at fair value through other comprehensive income, exchange differences are recognized in other comprehensive income in the revaluation reserve.
See the hedge accounting policy regarding exchange differences where the risk component of a foreign currency for a financial asset designated as a foreign currency risk hedging instrument.
Impairment of financial assets
The Entity recognizes a provision for expected credit losses on investments in debt instruments that are measured at amortized cost or fair value through other comprehensive income, lease receivables, trade receivables and contractual assets, as well as in financial guarantee contracts. The amount of expected credit losses is updated at each reporting date to reflect changes in credit risk since the initial recognition of the respective financial instrument.
The Entity recognises expected lifetime credit losses for trade receivables, contractual assets and lease receivables. Expected credit losses on these financial assets are estimated using a provision matrix based on the Entity's historical credit loss experience, adjusted for factors that are specific to the debtors, general economic conditions and an assessment of both current management and the forecast of conditions at the reporting date, including the time value of money when appropriate.
For all other financial instruments, the Entity recognises the expected lifetime credit loss when there has been a significant increase in credit risk since initial recognition. However, if the credit risk in the financial instrument has not increased significantly since initial recognition, the Entity measures the provision for losses for that financial instrument in an amount equal to the expected credit loss over 12 months.
Lifetime expected credit loss represents the expected credit losses that will result from all possible default events during the expected life of a financial instrument. In contrast, the expected 12-month credit loss represents the portion of the expected lifetime loss that is expected to result from default events in a financial instrument that are possible within 12 months of the reporting date.
i. Significant increase in credit risk
In assessing whether the credit risk in a financial instrument has increased significantly since initial recognition, the Entity compares the risk of default occurring in the financial instrument at the reporting date with the risk of default in the financial instrument at the date of initial recognition. In making this assessment, the Entity considers both quantitative and qualitative information that is reasonable and supported, including historical experience and prospective information that is available without undue cost or effort. Forward-looking information considered includes the future prospects of the industries in which the Entity's debtors operate, obtained from reports of economic experts, financial analysts, government agencies, relevant think tanks and other similar organizations, as well as consideration of various external sources of real information and projected economic information related to the Entity's core operations.
In particular, the following information is taken into account when assessing whether credit risk has increased significantly since initial recognition:
- A significant existing or expected deterioration in the external (if any) or internal rating of the financial instrument;
- Significant deterioration in external market indicators of credit risk for a specific financial instrument, for example, a significant increase in the credit spread, credit default swap for the debtor, or the period of time or extent to which the fair value of a financial asset is less than its amortized cost;
- Existing or expected adverse changes in economic, financial or business conditions that are expected to cause a significant decrease in the debtor's ability to meet its debt obligation;
- A significant current or expected deterioration in the debtor's operating results;
- Significant increases in credit risk in other financial instruments of the same debtor;
- An existing or expected adverse change in the debtor's regulatory, economic or technological conditions that results in a significant decrease in the debtor's ability to meet its obligations.
Regardless of the outcome of the previous assessment, the Entity assumes that the credit risk in a financial asset has increased significantly since initial recognition when contractual payments are more than 30 days overdue, unless the Entity has reasonable and reliable information demonstrating otherwise.
Notwithstanding the foregoing, the Entity assumes that the credit risk in a financial instrument has not increased significantly since initial recognition if the financial instrument is determined to have low credit risk at the reporting date. A financial instrument is determined to have low credit risk if:
- The financial instrument has a low risk of default,
- The debtor has a strong ability to meet its contractual cash flow obligations in the short term, and
- Adverse changes in long-term economic and business conditions may reduce the debtor's ability to meet its contractual cash obligations, but will not necessarily do so.
The Entity considers that a financial asset has low credit risk when the asset has an external credit rating of "investment grade" in accordance with the globally accepted definition, or if no external rating is available, when the asset has an internal rating of "performing". Performing means that the counterparty has a strong financial position and there are no past due amounts.
For financial guarantee contracts, the date on which the Entity becomes part of the irrevocable commitment is considered the date of initial recognition for purposes of assessing impairment of the financial instrument. In assessing whether there has been a significant increase in credit risk since the initial recognition of financial guarantee contracts, the Entity considers changes in the risk that the specified debtor will default on the contract.
The Entity regularly monitors the effectiveness of the criteria used to identify whether there has been a significant increase in credit risk and reviews them as appropriate to ensure that the criteria are capable of identifying a significant increase in credit risk before the amount is overdue.
ii. Definition of default
The Entity considers that the following constitutes an event of default for internal credit risk management purposes, as historical experience indicates that financial assets are not recoverable when they meet any of the following criteria:
- When the debtor breaches financial covenants;
- Internally developed or externally sourced information indicates that the debtor is unlikely to pay its creditors, including the Entity, in full (without taking into account any guarantee held by the Entity).
Regardless of the previous analysis, the Entity considers that default has occurred when a financial asset is more than 90 days overdue, unless the Entity has reasonable and reliable information to demonstrate that a later default criterion is more appropriate.
iii. Credit-impaired financial assets
A financial asset is credit-impaired when one or more events have occurred that have a detrimental impact on the estimated future cash flows of that financial asset. Evidence that a financial asset is credit-impaired includes observable data about the following events:
- Significant financial difficulty on the part of the issuer or debtor;
- Breach of a contract, such as default or a past due event (see (ii) above);
- The debtor's lenders, for economic or contractual reasons related to the debtor's financial difficulty, grant the debtor a concession that the lenders would not otherwise consider;
- It is increasingly likely that the debtor will enter bankruptcy or some other financial reorganization; or
- The extinction of a functional market for the financial asset due to its financial difficulties.
iv. Write-off policy
The Entity derecognizes a financial asset when there is information indicating that the debtor is in severe financial difficulty and there is no realistic prospect of recovery, for example, when the debtor has been placed in liquidation or has entered bankruptcy proceedings, or in the case of trade receivables, when the amounts are more than two years overdue, whichever occurs first. Financial assets written off may still be subject to enforcement activities under the Entity's recovery procedures, taking legal advice into account when appropriate. Any recovery made is recognized in profit or loss.
v. Measurement and recognition of expected credit losses
The measurement of expected credit losses is a function of the probability of default, loss given default (i.e., the magnitude of the loss if there is a default) and exposure at default. The assessment of the probability of default and loss given default is based on historical data adjusted for forward-looking information as described above. As for exposure at default, for financial assets, this is represented by the gross carrying amount of the assets at the reporting date; for financial guarantee contracts, exposure includes the amount established at the reporting date, together with any additional amount expected to be obtained in the future by default date determined based on historical trend, the Entity's understanding of the specific financial needs of debtors, and other relevant forward-looking information.
For financial assets, the expected credit loss is estimated as the difference between all contractual cash flows due to the Entity under the contract and all cash flows that the Entity expects to receive, discounted at the original effective interest rate. For a lease receivable, the cash flows used to determine expected credit losses are consistent with the cash flows used in measuring the lease receivable in accordance with IFRS 16 Leases.
For a financial guarantee contract, where the Entity is required to make payments only in the event of default by the debtor in accordance with the terms of the instrument that is guaranteed, the expected loss forecast is the expected payment to reimburse the holder for a credit loss incurred less any amount that the Entity expects to receive from the holder, the debtor or any other party.
Derecognition of financial assets
The Entity derecognizes a financial asset only when the contractual rights to the cash flows from the asset expire, or when it transfers the financial asset and substantially all the risks and rewards of ownership of the asset to another entity. If the Entity retains substantially all the risks and rewards of ownership of a transferred financial asset, the Entity continues to recognize the financial asset and also recognizes a secured loan for the proceeds received.
When derecognizing a financial asset measured at amortized cost, the difference between the carrying amount of the asset and the sum of the consideration received and receivable is recognized in profit or loss. In addition, when derecognizing an investment in a debt instrument classified as fair value through other comprehensive income, the cumulative gain or loss previously accumulated in the investment revaluation reserve is reclassified to profit or loss. In contrast, when derecognizing an investment in an equity instrument that the Entity elected at initial recognition to measure at fair value through other comprehensive income, the cumulative gain or loss previously accumulated in the investment revaluation reserve is not reclassified to profit or loss, but is transferred to retained earnings (deficit).
- Financial liabilities and equity
Classification as debt or equity
Debt and equity instruments are classified as financial liabilities or as equity in accordance with the substance of the contractual arrangements and the definitions of a financial liability and an equity instrument.
Equity instruments
An equity instrument is any contract that evidences a residual interest in the assets of an entity after deducting all its liabilities. Equity instruments issued by the Entity are recognized at the proceeds received, net of direct issuance costs.
The repurchase of the Entity's own equity instruments is recognized and deducted directly in equity. No gain or loss is recognized in profit or loss on the purchase, sale, issuance or cancellation of the Entity's own equity instruments.
Financial liabilities
All financial liabilities are subsequently measured at amortized cost using the effective interest method or at fair value through profit or loss.
However, financial liabilities that arise when a transfer of a financial asset does not qualify for derecognition or when the continuing involvement approach is applied, and financial guarantee contracts issued by the Entity, are measured in accordance with the specific accounting policies detailed below.
Financial liabilities at fair value through profit or loss
Financial liabilities are classified as fair value through profit or loss when the financial liability is (i) contingent consideration of an acquirer in a business combination, (ii) held for trading or (iii) designated as fair value through profit or loss.
A financial liability is classified as held for trading if:
- It has been acquired mainly for the purpose of repurchasing it in the short term; or
- In initial recognition, it is part of a portfolio of identified financial instruments that the Entity jointly manages and has a recent actual pattern of short-term profit-taking; or
- It is a derivative, except for derivatives that are a financial guarantee contract or a designated and effective hedging instrument.
A financial liability that is not held for trading or contingent consideration of an acquirer in a business combination may be designated as fair value through profit or loss at the time of initial recognition if:
- Such designation eliminates or significantly reduces a measurement or recognition inconsistency that would otherwise arise; or
- The financial liability is part of an Entity of financial assets or financial liabilities or both, which is managed and its performance evaluated on the basis of fair value, in accordance with the Entity's documented risk management or investment strategy, and information about the grouping is provided internally on that basis; or
- It forms part of a contract that contains one or more embedded derivatives, and IFRS 9 allows the entire combined contract to be designated as fair value through profit or loss.
Financial liabilities at fair value through profit or loss are measured at fair value, and gains or losses arising from changes in fair value are recognized in profit or loss to the extent that they are not part of a designated hedging relationship (see hedge accounting policy). The net gain or loss recognized in profit or loss incorporates any interest paid on the financial liability and is included under "other (income) expenses, net" (Note 29) in profit or loss.
However, for financial liabilities designated as fair value through profit or loss, the amount of change in the fair value of the financial liability that is attributable to changes in the credit risk of that liability is recognized in other comprehensive income, unless recognizing the effects of changes in the liability's credit risk in other comprehensive income would create or enlarge an accounting mismatch in profit or loss. The remaining amount of the change in the fair value of the liability is recognized in profit or loss. Changes in fair value attributable to the credit risk of a financial liability that are recognized in other comprehensive income are not subsequently reclassified to profit or loss. Instead, they are transferred to retained earnings once the financial liability is derecognized.
Financial liabilities subsequently measured at amortized cost
Financial liabilities that are not (i) contingent consideration of an acquirer in a business combination, (ii) held for trading, or (iii) designated as fair value through profit or loss, are subsequently measured at amortized cost using the effective interest method.
Foreign exchange gains and losses
For financial liabilities that are denominated in a foreign currency and measured at amortized cost at the end of each reporting period, foreign currency gains and losses are determined based on the amortized cost of the instruments. These foreign currency gains and losses are recognized under "Other (income) expenses, net" in profit or loss (Note 29) for financial liabilities that are not part of a designated hedging relationship. For those designated as a hedging instrument for a foreign currency risk hedge, foreign currency gains and losses are recognized in other comprehensive income and accumulated in a separate component of equity.
The fair value of financial liabilities denominated in a foreign currency is determined in that foreign currency and converted at the exchange rate at the end of the reporting period. For financial liabilities measured at fair value through profit or loss, the foreign currency component forms part of the fair value gains or losses and is recognized in profit or loss for financial liabilities that are not part of a designated hedging relationship.
Derecognition of financial liabilities
The Entity derecognizes financial liabilities if, and only if, the Entity's obligations are fulfilled, cancelled or have expired. The difference between the carrying amount of the derecognized financial liability and the consideration paid and payable is recognized in profit or loss.
When the Entity exchanges with the existing lender a debt instrument into another with substantially different terms, such exchange is accounted for as an extinguishment of the original financial liability and the recognition of a new financial liability. Similarly, the Entity considers the substantial modification of the terms of an existing liability or part of it as an extinguishment of the original financial liability and the recognition of a new liability. Terms are assumed to be substantially different if the discounted present value of cash flows under the new terms, including any fee paid net of any fee received and discounted using the original effective rate, is at least 10% different from the discounted present value of the remaining cash flows of the original financial liability. If the modification is not substantial, the difference between: (1) the carrying amount of the liability before the modification; and (2) the present value of the cash flows after the modification should be recognized in profit or loss as the modification gain or loss within other gains and losses.
- Derivative financial instruments
The Entity participates in a variety of derivative financial instruments to manage its exposure to interest rate, exchange rate and prices of some metals risks
including foreign currency forward contracts, forwards and interest rate swaps. Additional details of derivative financial instruments are disclosed in Note 14.
Derivatives are initially recognized at fair value on the date a derivative contract is entered into and are subsequently remeasured at fair value at each reporting date. The resulting gain or loss is recognized in profit or loss immediately unless the derivative is designated and effective as a hedging instrument, in which case the timing of recognition in profit or loss depends on the nature of the hedging relationship.
A derivative with a positive fair value is recognized as a financial asset, while a derivative with a negative fair value is recognized as a financial liability. Derivatives are not offset in the consolidated financial statements unless the Entity has both the legal right and intention to offset. A derivative is presented as a non-current asset or a non-current liability if the remaining maturity of the instrument is more than 12 months and is not expected to be realized or settled within 12 months. Other derivatives are presented as current assets or current liabilities.
- Hedge accounting
The Entity designates certain derivatives as hedging instruments with respect to foreign currency risk and interest rate risk in fair value hedges, cash flow hedges or hedges of net investments in foreign operations. Foreign exchange risk hedges in firm commitments are accounted for as cash flow hedges.
At the beginning of the hedging relationship, the Entity documents the relationship between the hedging instrument and the hedged item, together with its risk management objectives and its strategy for carrying out various hedging transactions. In addition, at the beginning of the hedge and on an ongoing basis, the Entity documents whether the hedging instrument is effective in offsetting changes in the fair values or cash flows of the hedged item attributable to the hedged risk, which is when hedging relationships meet all of the following hedge effectiveness requirements:
- There is an economic relationship between the hedging instrument and the hedged item;
- The effect of credit risk does not dominate the value of the changes that result from the economic relationship; and
- The hedging ratio of the hedging relationship is the same as that resulting from the amount of the hedged item that the Entity actually hedges and the amount of the hedging instrument that the Entity actually uses to hedge that amount of the hedged item.
If a hedging relationship ceases to meet the hedge effectiveness requirement related to the hedging relationship, but the risk management objective for that designated hedging relationship remains the same, the Entity adjusts the hedging relationship of the hedging relationship (i.e., rebalances the hedge) so that it meets the qualification criteria again.
The Entity designates the entire change in the fair value of a forward contract (i.e., includes forward elements) as the hedging instrument for all its hedging relationships involving forward contracts.
Note 14 sets out details of the fair values of derivative instruments used for hedging purposes.
Movements in the hedge reserve in equity are detailed in Note 14.
Fair value hedges
The change in the fair value of qualified hedging instruments is recognized in profit or loss, except when the hedging instrument hedges an equity instrument designated at fair value through other comprehensive income, in which case it is recognized in other comprehensive income.
The carrying amount of a hedged item that has not yet been measured at fair value is adjusted for the change in fair value attributable to the hedged risk with a corresponding entry in profit or loss. For debt instruments measured at fair value through other comprehensive income, the carrying amount is not adjusted because it is at fair value, but the hedging gain or loss is recognized in profit or loss instead of other comprehensive income. When the hedged item is an equity instrument designated at fair value through other comprehensive income, the hedging gain or loss remains in other comprehensive income to match that of the hedging instrument.
When hedging gains or losses are recognized in profit or loss, they are recognized on the same line as the hedged item.
The Entity discontinues hedge accounting only when the hedging relationship (or a part thereof) ceases to meet the qualification criteria (after rebalancing, if applicable). This includes cases where the hedging instrument matures or is sold, cancelled or exercised. Discontinuation is accounted for prospectively. The fair value adjustment to the carrying amount of the hedged item arising from the hedged risk is amortized to profit or loss from that date.
Cash flow hedges
The effective portion of changes in the fair value of derivatives and other qualifying hedging instruments that are designated and qualify as cash flow hedges are recognized in other comprehensive income and accumulated in the cash flow hedge reserve, limited to the cumulative change in the fair value of the hedged item since the inception of the hedge. The gain or loss related to the ineffective portion is recognized immediately in profit or loss.
Amounts previously recognized in other comprehensive income and accumulated in equity are reclassified to profit or loss in the periods in which the hedged item affects profit or loss, on the same line as the recognized hedged item. However, when the hedged forecast transaction results in the recognition of a non-financial asset or non-financial liability, gains and losses previously recognized in other comprehensive income and accumulated in equity are removed from equity and included in the initial measurement of the cost of the non-financial asset or non-financial liability. This transfer does not affect other comprehensive income.
In addition, if the Entity expects that part or all of the accumulated loss in the cash flow hedge reserve will not be recovered in the future, that amount will be immediately reclassified to profit or loss.
The Entity discontinues hedge accounting only when the hedging relationship (or a part thereof) ceases to meet the qualification criteria (after rebalancing, if applicable). This includes cases where the hedging instrument matures or is sold, cancelled or exercised. Discontinuation is accounted for prospectively.
Any gain or loss recognized in other comprehensive income and accumulated in the cash flow hedge reserve at that time remains in equity and is reclassified to profit or loss when the forecast transaction occurs. When a forecast transaction is no longer expected to occur, the gain or loss accumulated in the cash flow hedge reserve is immediately reclassified to profit or loss.
-
Inventories and cost of sales - Inventories are valued at the lower of acquisition and/or construction cost or net realizable value (estimated selling price less all costs necessary to make the sale), the lower, as follows:
- Industrial, construction and commercial inventories - They are valued through the first-in first-out system and/or average costs depending on the activity of each subsidiary; including the cost of materials, direct expenses and an appropriate portion of fixed and variable indirect costs, which are incurred in their transformation by the activity of each subsidiary. Reductions in inventory value are composed of reserves that represent impairment of inventories. Net realizable value represents the estimated selling price less all estimated costs of completion and costs incurred in marketing, selling and distribution.
- Real estate inventories - Real estate inventory is valued at the lower of cost or net realizable value. Land to be developed is tested for impairment if there are indications that its value will not be recoverable. Real estate inventory includes all direct land, development and construction costs and others incurred during the development stage, as well as financial costs. Real estate development costs include land, materials, subcontracts, and all indirect costs related to such developments, such as indirect labor, purchases, repairs and depreciation. General and administrative expenses are charged to profit or loss when incurred.
In the event that the estimated total costs of real estate developments exceed the estimated total revenues, the expected loss is recorded against the results of the year. The cost of sales of real estate inventories is determined and prorated based on total costs of developments or projects.
The Entity classifies as long-term inventories those lands whose exploitation phase is longer than one year.
- Property, plant and equipment - As of January 1, 2011, the date of transition to IFRS, property, plant and equipment were valued at their assumed cost (depreciated cost adjusted by the National Consumer Price Index). Subsequent acquisitions are recorded at acquisition cost. Depreciation is recorded in profit or loss and calculated using the straight-line method based on the estimated remaining useful lives of the components of the assets, which are reviewed each year together with residual values; and the effect of any change in estimate recorded is recognized on a prospective basis. Depreciation of machinery and equipment of some subsidiaries and specific equipment is calculated according to the units-of-use method (machine hours used in relation to the total hours of use of the assets during their estimated service life).
| % average depreciation rate | % residual value | |
|---|---|---|
| Buildings and adaptations to | 1.4 to 10 | 5 and 10 |
| leased premises | 4.1 to 5 | - |
| Machinery and Equipment | 25 | 5, 10 and 25 |
| Transportation equipment | 5 to 12.8 | - |
| Office furniture and equipment | 16.7 to 31.2 | - |
| Computer equipment |
Land is not depreciated.
Borrowing costs incurred during the period of construction and installation of qualifying property, plant and equipment are capitalized.
The gain or loss arising from the sale or retirement of an item of property, plant and equipment is calculated as the difference between the proceeds received from its sale and the carrying amount of the asset, and is recognized in profit or loss.
Property and machinery in the process of construction, for production purposes, are recorded at cost less any recognized impairment loss.
The cost includes professional fees and, in the case of qualifying assets, borrowing costs capitalized in accordance with the Entity's accounting policy. Depreciation of these assets, like other properties, begins when the assets are ready for their intended use.
- Investment Properties - Investment properties are those held for lease and/or capital gains through appreciation in value over time (including properties under construction for such purpose). Investment properties are valued at their fair value determined through valuations performed by independent appraisers. Gains or losses arising from changes in the fair value of the investment property are included in the period in which they arise in the account "other expenses (income), net" in the consolidated statement of income in the period in which they arise.
Acquired investment properties and improvements are recorded at acquisition cost, including transaction costs related to the acquisition of assets.
An investment property is removed at the time of disposal or when it is permanently withdrawn from use and no future economic benefits are expected from the disposal. Any gain or loss arising from the disposal of the property (calculated as the difference between the net proceeds from disposal and the carrying amount of the asset) is included in the consolidated statement of income in the period in which the property is removed.
- Intangible assets - Intangible assets acquired separately are recognized in the consolidated statement of financial position provided that they are identifiable, provide future economic benefits and there is control over such benefits. Intangible assets with indefinite useful lives are not amortized and intangible assets with definite lives are systematically amortized based on the best estimate of their useful life, determined according to the expectation of future economic benefits. The estimated useful life and amortization method are reviewed at the end of each year, with the effect of any change in estimate recorded on a prospective basis. Intangible assets with indefinite useful lives that are acquired separately are recorded at cost less accumulated impairment losses.
Disbursements arising from research activities are recognized as an expense in the period in which they are incurred.
- Impairment of tangible and intangible assets excluding goodwill - The Entity reviews the carrying amounts of its tangible and intangible assets to determine whether there are indications that these assets have suffered any impairment loss. If any indication exists, the recoverable amount of the asset is calculated to determine the extent of the impairment loss. When it is not possible to estimate the recoverable amount of an individual asset, the Entity estimates the recoverable amount of the Cash-Generating Unit (CGU) to which that asset belongs. When a reasonable and consistent basis of allocation can be identified, corporate assets are also assigned to individual CGUs, otherwise they are assigned to the smallest group of CGUs for which a reasonable and consistent basis of allocation can be identified.
Intangible assets that have an indefinite useful life are tested for impairment at least annually, and whenever there is an indication that the asset may be impaired.
The recoverable amount is the higher of fair value less cost to sell and value in use. In assessing value in use, estimated future cash flows are discounted to their present value using a pre-tax discount rate that reflects the current market assessment of the time value of money and the risks specific to the asset for which future cash flow estimates have not been adjusted.
If the recoverable amount of an asset (or CGU) is estimated to be less than its carrying amount, the carrying amount of the asset (or CGU) is reduced to its recoverable amount. Impairment losses are recognized in profit or loss, unless the asset is carried at a revalued amount, in which case the impairment loss should be considered as a decrease in revaluation.
- Goodwill - Goodwill arising from a business combination is recognized at historical cost as an asset at the date control is acquired (acquisition date), less impairment losses
recognized, if any. Goodwill is the excess of the consideration transferred, the amount of any non-controlling interest in the acquiree, over the fair value of the acquirer's interest in the acquiree's stockholders' equity and/or over the net amount at the acquisition date of the identifiable assets acquired and liabilities assumed.
When the fair value of the identifiable net assets of the acquiree exceeds the sum of the consideration transferred, the amount of such excess is recognized in profit or loss as a purchase gain.
Goodwill is not amortized and is tested for impairment annually. For impairment assessment purposes, goodwill is assigned to each of the CGUs from which the Entity expects to obtain benefits. If the recoverable amount of the CGU is less than the carrying amount of the unit, the impairment loss is first allocated to reduce the carrying amount of goodwill allocated to the unit and then to the other assets of the unit, proportionally, based on the carrying amount of each asset in the unit. The impairment loss recognized for goodwill purposes cannot be reversed in a subsequent period.
When disposing of a relevant CGU, the amount attributable to goodwill is included in the determination of the gain or loss on disposal.
- Investment in shares of associates and joint ventures and others - An associate is an entity over which the Entity has significant influence. Significant influence is the power to participate in decisions about the financial and operating policies of the investee, but does not imply control or joint control over those policies.
A joint venture is a contractual arrangement whereby the parties that have joint control of the arrangement have rights to the net assets of the joint venture. Joint control is the contractual arrangement for sharing control in a business, which exists when decisions about relevant activities require unanimous approval of the parties sharing control.
The results and assets and liabilities of associates or joint ventures are incorporated into the financial statements using the equity method, except if the investment, or a portion thereof, is classified as held for sale, in which case it is accounted for in accordance with IFRS 5, Non-current Assets Held for Sale and Discontinued Operations. Under the equity method, investments in associates or joint ventures are initially accounted for in the consolidated statement of financial position at cost and adjusted for subsequent changes after acquisition by the Entity's share of the profit or loss and comprehensive income of the associate or joint venture. When the Entity's share of losses in an associate or joint venture exceeds the Entity's interest in that associate or joint venture (which includes long-term interests that, in substance, form part of the Entity's net investment in the associate or joint venture), the Entity ceases to recognize its share of losses.
Additional losses are recognized provided that the Entity has incurred any legal or constructive obligation or has made payments on behalf of the associate or joint venture.
An investment in an associate or joint venture is recorded using the equity method from the date on which the investee becomes an associate or joint venture. On acquisition of the investment in an associate or joint venture, the excess of the cost of acquisition over the Entity's share of the net fair value of identifiable assets and liabilities in the investment is recognized as goodwill, which is included in the carrying amount of the investment. Any excess of the Entity's share in the net fair value of identifiable assets and liabilities over the acquisition cost of the investment is recognized immediately in the results of the period in which the investment was acquired.
The requirements of IFRS 9 are applied to determine whether it is necessary to recognize an impairment loss with respect to the Entity's investment in an associate or joint venture. When necessary, impairment of the total carrying amount of the investment (including goodwill) is tested in accordance with IAS 36, Impairment of Assets, as a single asset, comparing its recoverable amount (higher of value in use and fair value less cost to sell) against its carrying amount. Any impairment loss recognized forms part of the carrying amount of the investment. Any reversal of such impairment loss is recognized in accordance with IAS 36 to the extent that the recoverable amount of the investment subsequently increases.
The Entity discontinues the use of the equity method from the date on which the investment ceases to be an associate or joint venture, or when the investment is classified as held for sale. When the Entity maintains an interest in the former associate or joint venture, the retained investment is measured at fair value at that date and is considered its fair value at initial recognition as a financial asset in accordance with IFRS 9. The difference between the carrying amount of the associate or joint venture on the date the equity method was discontinued and the fair value attributable to the retained interest and the gain on the sale of a portion of the interest in the associate or joint venture is included in the determination of the gain or loss on disposal of the associate or joint venture. In addition, the Entity accounts for all amounts previously recognized in other comprehensive income in relation to that associate or joint venture on the same basis that would be required if that associate or joint venture had directly disposed of the related assets or liabilities.
The Entity continues to use the equity method when an investment in an associate becomes an investment in a joint venture or an investment in a joint venture becomes an investment in an associate. There is no fair value assessment for such changes in interest.
When the Entity reduces its interest in an associate or joint venture but the Entity continues to use the equity method, the Entity reclassifies to profit or loss the proportion of the gain or loss previously recognized in other comprehensive income in relation to the reduction of its interest in the investment if that gain or loss would have been reclassified to the statement of income on disposal of the related assets or liabilities.
When the Entity carries out transactions with its associate or joint venture, the gain or loss resulting from such transactions with the associate or joint venture is recognized in the Entity's consolidated financial statements only to the extent of the interest in the associate or joint venture that is not related to the Entity.
- Interests in joint operations
A joint operation is an arrangement whereby the parties have joint control of the arrangement and therefore have rights to the assets and obligations for the liabilities related to the arrangement. Joint control is the contractual arrangement for sharing control of a business, which only exists when decisions about relevant activities require the unanimous approval of the parties sharing control.
When an entity of the Entity carries out its activities within a joint operation framework, the Entity as joint operator recognizes in relation to its interest in a joint operation:
- Its assets, including its share of assets held jointly.
- Its liabilities, including its share of liabilities incurred jointly.
- Its income from the sale of its share of production derived from the joint operation.
- Its interest in income from the sale of production in the joint operation.
- Its expenses, including its share of expenses incurred jointly.
The Entity accounts for the assets, liabilities, income and expenses related to its interest in a joint operation in accordance with the IFRS applicable to the assets, liabilities, income and expenses.
When an entity of the Entity carries out transactions with a joint operation in which it participates (such as a sale or contribution of assets), the Entity is considered to carry out the transaction with the other parties in the joint operation, and the gains and losses resulting from the transactions are recorded in the Entity's consolidated financial statements only to the extent of the interests of the other parties in the joint operation.
- Business combinations - Business acquisitions are accounted for using the acquisition method. The consideration transferred in a business combination is measured at fair value, which is calculated as the sum of the fair values of the assets transferred by the Entity, less the liabilities incurred by the Entity with the previous owners of the acquired business and the equity interests issued by the Entity in exchange for control over the acquired business at the acquisition date. Acquisition-related costs are generally recognized in the consolidated statement of income as incurred.
At the acquisition date, identifiable assets acquired and liabilities assumed are recognized at fair value except for:
- Deferred tax assets or liabilities and assets or liabilities related to employee benefits, which are recognized and measured in accordance with IAS 12, Income Taxes, and IAS 19, Employee Benefits, respectively;
- Liabilities or equity instruments related to share-based payment arrangements of the acquired company or share-based payment arrangements of the Entity entered into to replace share-based payment arrangements of the acquired company that are measured in accordance with IFRS 2, Share-based Payments, at the acquisition date; and
- Assets (or a group of assets for disposal) that are classified as held for sale in accordance with IFRS 5, Non-current Assets Held for Sale and Discontinued Operations, which are measured in accordance with that standard.
Non-controlling interests that are equity interests and that grant their holders a proportional share of the Entity's net assets in the event of liquidation may initially be measured either at fair value or at the value of the proportional interest of the non-controlling interest in the recognized amounts of the identifiable net assets of the acquired company. The measurement option is made in each transaction. Other types of non-controlling interests are measured at fair value or, when applicable, based on the specifications of another IFRS.
When the consideration transferred by the Entity in a business combination includes assets or liabilities resulting from a contingent consideration arrangement, the contingent consideration is measured at fair value at the acquisition date and included as part of the consideration transferred. Changes in the fair value of contingent consideration that qualify as measurement period adjustments are adjusted retrospectively with corresponding adjustments against goodwill. Measurement period adjustments are adjustments arising from additional information obtained during the "measurement period" (which cannot be longer than one year from the acquisition date) about facts and circumstances that existed at the acquisition date.
The accounting treatment for changes in the fair value of contingent consideration that do not qualify as measurement period adjustments depends on how the contingent consideration is classified. Contingent consideration classified as equity is not remeasured at subsequent reporting dates and its subsequent settlement is accounted for within equity. Contingent consideration classified as an asset or liability is remeasured at subsequent reporting dates in accordance with IFRS 9, or IAS 37,
Provisions, Contingent Liabilities and Contingent Assets, as appropriate, recognizing the corresponding gain or loss in the statement of income.
When a business combination is achieved in stages, the Entity's previous equity interest in the acquired company is remeasured at fair value at the acquisition date and the resulting gain or loss, if any, is recognized in the statement of income. Amounts arising from interests in the acquired company before the acquisition date that have been previously recognized in other comprehensive income are reclassified to the statement of income when this treatment is appropriate if such interest is disposed of.
If the initial accounting treatment of a business combination is incomplete at the end of the reporting period in which the combination occurs, the Entity reports provisional amounts for the items whose accounting is incomplete. Such provisional amounts are adjusted during the measurement period (see above) or additional assets or liabilities are recognized to reflect new information obtained about the facts and circumstances that existed at the acquisition date and that, had they been known, would have affected the amounts recognized at that date.
When an intangible asset is acquired in a business combination and recognized separately from goodwill, its cost is its fair value at the acquisition date. An intangible asset acquired in a business combination is recognized at cost less accumulated amortization and accumulated impairment losses, on the same basis as intangible assets acquired separately.
In estimating value in use, estimated future cash flows are discounted from present value using a pre-tax discount rate that reflects current market assessments of the time value of money and the risks specific to the asset for which future cash flows have not been adjusted.
-
Leases -.
- The Entity as lessor
The Entity enters into lease contracts as lessor with respect to some investment properties. The Entity also leases to retailers the equipment necessary for the presentation and development of their activities and equipment manufactured by the Entity.
Leases in which the Entity serves as lessor are classified as finance leases or operating leases. When the terms of the contract transfer substantially all risks and rewards of ownership to the lessee, the contract is classified as a finance lease. All other contracts are classified as operating contracts.
When the Entity is an intermediate lessor, it accounts for the main lease and sublease as two separate contracts. The sublease is classified as a finance lease or operating lease in reference to the right-of-use asset arising from the main lease.
Rental income from operating leases is recognized on a straight-line basis over the relevant lease term. Initial direct costs incurred in negotiating and arranging the operating lease are added to the carrying amount of the leased asset and are recognized on a straight-line basis over the lease term.
Outstanding amounts from finance leases are recognized as lease receivables in the amount of the net investment in the leases. Finance lease income is allocated to accounting periods in a manner that reflects a constant periodic rate of return on the outstanding net investment in respect of the leases.
When a contract includes lease and non-lease components, the Entity applies IFRS 15 to allocate the consideration corresponding to each component under the contract.
- The Entity as lessee
The Entity assesses whether a contract contains a lease at inception. The Entity recognizes a right-of-use asset and a corresponding lease liability with respect to all lease contracts in which it is the lessee, except for short-term leases (term of 12 months or less) and low-value asset leases (such as electronic tablets, personal computers and small items of office furniture and telephones). For these leases, the Entity recognizes rental payments as an operating expense using the straight-line method over the lease term, unless another method is more representative of the time pattern in which economic benefits from the consumption of leased assets are obtained.
The lease liability is initially measured at the present value of rental payments that are not paid at the commencement date, discounted by the rate implicit in the contract. If this rate cannot be readily determined, the Entity uses incremental rates.
The rental payments included in the measurement of the lease liability consist of:
- Fixed rental payments (including in-substance fixed payments), less any lease incentives received;
- Variable rental payments that depend on an index or rate, initially measured using the index or rate at the commencement date;
- The amount expected to be payable by the lessee under residual value guarantees;
- The exercise price of purchase options, if the lessee is reasonably certain to exercise the options; and
- Penalty payments resulting from lease termination, if the lease period reflects the exercise of a lease termination option.
The lease liability is presented as a separate item in the consolidated statement of financial position.
The lease liability is subsequently measured by increasing the carrying amount to reflect interest accrued on the lease liability (using the effective interest method) and reducing the carrying amount to reflect rental payments made.
The Entity remeasures the lease liability (and makes the corresponding adjustment to the related right-of-use asset) whenever:
- The lease term is modified or there is a significant event or change in lease circumstances resulting in a change in the assessment of exercise of a purchase option, in which case the lease liability is measured by discounting the updated rental payments using an updated discount rate.
- Rental payments are modified as a consequence of changes in indexes or rates or a change in the expected payment under a residual value guarantee, in which cases the lease liability is remeasured by discounting the updated rental payments using the same discount rate (unless the change in rental payments is due to a change in a variable interest rate, in which case an updated discount rate is used).
- A lease contract is modified and the lease modification is not accounted for as a separate lease, in which case the lease liability is remeasured based on the lease term of the modified lease, discounting the updated rental payments using an updated discount rate at the effective date of the modification.
The Entity did not make any of the adjustments mentioned in the periods presented.
Right-of-use assets consist of the initial measurement of the corresponding lease liability, rental payments made on or before the commencement date, less any lease incentives received and any initial direct cost. Subsequent valuation is cost less accumulated depreciation and impairment losses.
If the Entity incurs an obligation arising from costs to dismantle and remove a leased asset, restore the site on which it is located or restore the underlying asset to the condition required by the terms and conditions of the lease, a provision measured in accordance with IAS 37 should be recognized. To the extent that the costs relate to a right-of-use asset, the costs are included in the related right-of-use asset, unless such costs are incurred to generate inventories.
Right-of-use assets are depreciated over the shorter of the lease period and the useful life of the underlying asset. If a lease transfers ownership of the underlying asset or the cost of the right-of-use asset reflects that the Entity plans to exercise a purchase option, the right-of-use asset will be depreciated over the useful life. Depreciation begins at the lease commencement date.
Right-of-use assets are presented as a separate item in the consolidated statement of financial position.
The Entity applies IAS 36 to determine whether a right-of-use asset is impaired and accounts for any identified impairment loss as described in the "Property, plant and equipment" policy.
Leases with variable rents that do not depend on an index or rate are not included in the measurement of the lease liability and right-of-use asset. Related payments are recognized as an expense in the period in which the event or condition that triggers the payments occurs and are included in "Costs and expenses by nature" in the consolidated statement of income (Note 28).
As a practical expedient, IFRS 16 allows non-lease components not to be separated and instead any lease and its associated non-lease components to be accounted for as a single arrangement. The Entity has not used this practical expedient. For contracts that contain lease components and one or more additional lease or non-lease components, the Entity assigns contract consideration to each lease component under the relative stand-alone selling price method of the lease component and aggregate stand-alone relative selling price for all non-lease components.
- Provisions - Recognized when there is a present obligation (legal or presumed) as a result of a past event, which is likely to result in the outflow of economic resources and which can be reasonably estimated.
The amount recognized as a provision is the best estimate of the present obligation that would be required at the end of the reported accounting period, considering the risks and uncertainties regarding said obligation. When a provision is measured using estimated cash flows at present value, the carrying amount will be the present value of such cash flows (when the effect of the time value of money is material).
When recovery from a third party of some or all of the economic benefits required to settle a provision is expected, a receivable is recognized as an asset if it is virtually certain that the disbursement will be received and the amount of the receivable can be reliably valued.
- Provision to remedy damage to the environment - The Entity has assumed policies that tend to protect the environment within the framework of the laws and regulations that apply to it; however, the industrial subsidiaries of the Entity, due to their own activity, sometimes carry out operations that have an impact on the environment. Because of this, remediation plans are carried out (approved by competent authorities), which involve the estimation of the expenditures that will be made for this purpose.
The estimate of the expenditures to be made may be modified by changes in the physical conditions of the affected work area, in the activity carried out, in the laws and regulations in force, by variations in the prices of materials and services required (especially in the work to be carried out in the immediate future), by changes in the criteria followed to determine the work to be carried out in the impacted area, etc.
The fair value of a liability for the environmental remediation obligation is recognized in the period in which it is incurred. The liability is measured at fair value and adjusted as the expense is recorded. The corresponding costs for environmental remediation are recorded in the results.
- Acquisition and sale of treasury shares - Purchases of shares are recorded directly as a reduction of the share capital to its nominal theoretical value, and the difference against the acquisition cost is recorded against the reserve for share repurchases, which is included in retained earnings. Sales of shares are recorded directly as an increase in share capital to its notional nominal value and are considered in determining the weighted average of shares outstanding. The gain or loss on the sale is recorded as a premium on stock relocation, and the difference against the sale price is recorded against the share repurchase reserve, which is included in retained earnings.
-
Revenue recognition - Revenue is recognized when control of goods and services has been transferred, at a point in time or across time. Revenue is calculated at the fair value of the consideration collected or receivable, taking into account the estimated amount of customer returns, rebates and other similar discounts. By sector type, revenue recognition is performed according to the following criteria:
- Sale of goods - For sales of goods, income is recognized when control of the goods has been transferred, being the time when the goods are handed over and their title to ownership is legally transferred; this is a point in time for the commercial sector (Sanborns, Sears, Sanborns Home & Fashion, iShop-Mixup, Claro Shop, DAX, Sanborns Café and Tech People), in the industrial sector (cables and auto parts sector) over a period of time and in the hydrocarbons sector (Oil and Gas).
- Interest on credit sales - Interest income on credit sales is recognized when accrued and generated by credit card transactions in the commercial segment (Sanborns, Sears, Mixup, Claro Shop and Corpti).
- Services - Recognized as services are provided that economic benefits are likely to flow to the Entity and that income can be reliably valued. Revenue recognition is generally over time.
- Leases - Recognized on a straight-line basis as lease services are provided and maintenance fee income is recognized over the term of the lease from which it originates.
- Construction contracts - When the results of a construction contract can be reliably estimated, revenues are recorded using the percentage of completion method based on costs incurred, taking into account the estimated costs and revenues at the end of the project, as the activity develops. Changes in the execution of the work, and in the estimated margins, including those that may arise from awards derived from the early completion of projects, conventional penalties and final agreements in the contracts, are recognized as income in the periods in which the reviews are made or approved by the clients. Income is recognized when control of the assets has been transferred. Revenue is generally recognized over time.
Under the terms of several contracts, the revenue that is recognized is not necessarily related to amounts billable to customers. Management periodically evaluates the reasonableness of its accounts receivable. In cases where there are indications of difficulty in their recovery, additional reserves are established for doubtful accounts receivable, affecting the results of the year in which they are determined. The estimation of such reserve is based on the best judgment of the Entity considering the circumstances prevailing at the time of its determination.
Contract costs include labor, direct raw materials, subcontractor costs, project start-up costs, and indirect costs. From time to time, the Entity evaluates the reasonableness of the estimates used in determining the percentage of completion. If, as a result of such assessment, there are indications that the estimated costs to be incurred until the completion of the project are higher than the expected revenues, a loss estimate provision is recognized for the period in which it is determined. In work projects financed by the Entity in which the value of the contract includes the income from the execution of the work and financing, the net financial expense (income) incurred, necessary for the development of the project, is part of the costs of the contract, which are recognized in results according to the progress of the execution of the project. In this type of contracts, the collection of the total amount of the project from the client may be carried out until the date of completion of the project through periodic reports on the progress of the project approved by the client, which serve as a basis for the Entity to obtain, where appropriate, the financing of the project in question.
- Modifications to construction contracts - Recognized when their amount can be reliably quantified and there is reasonable evidence of their approval by the client. Claims revenue is recognized when it can be reliably quantified and when, derived from progress in the negotiation, there is reasonable evidence that the customer will accept its payment.
- Income from real estate developments - Recognized on the date of delivery of the respective home, in which the rights, benefits and obligations of the property are transferred to the buyer. If there is uncertainty about future collections, the income is recorded as they are made. In cases where there are indications of difficulty in recovering, additional reserves are established for doubtful receivables, affecting the results of the year in which they are determined. Revenue is usually recognized at a point in time.
- Dividends and interest - Dividend income from other investments is recognized once the rights of shareholders to receive this payment have been established (provided that economic benefits are likely to flow to the Entity and that the income can be reliably valued).
Interest income on financial assets is recognized when accrued and there is a probability that the economic benefits will flow to the Entity and the amount of the income can be reliably measured.
- Customer loyalty programs - Awards are accounted for as a performance obligation separate from the sale transaction, measured at fair value and recognized as Contractual Liabilities, in the consolidated statement of financial position, within other accounts payable and accrued liabilities. Deferred earnings are recognized in results once the prize is redeemed or expires.
- Foreign currency transactions - In preparing each entity's financial statements, transactions in currencies other than its functional currency (foreign currency) are recognized using the exchange rates in effect on the dates on which the transactions are made. At the end of each period, monetary items denominated in foreign currency are reconverted at the exchange rates in force on that date. Non-monetary items recorded at fair value, denominated in foreign currency, are reconverted at the exchange rates in effect on the date on which the fair value was determined. Non-monetary items that are calculated in terms of historical cost, in foreign currency, are not reconverted.
For the purposes of the presentation of the consolidated financial statements, the Entity's assets and liabilities in foreign currency are expressed in Mexican pesos, using the exchange rates in effect at the end of the period. Income and expenditure items are translated at the prevailing average rates of exchange for the period, unless they fluctuate significantly, in which case the exchange rates at the date of the transactions are used. Exchange rate differences that arise, if any, are recognized in other comprehensive income and are accumulated in stockholders' equity (attributed to non-controlling interests where appropriate).
The functional and registration currency of Grupo Carso and subsidiaries is the Mexican peso, except for some indirect subsidiaries whose registration and/or functional currencies are different from the Mexican peso as follows:
| Subsidiary | Recording currency | Functional currency |
|---|---|---|
| Cablena, S. A. | Euro | Euro |
| Cablena do Brasil, Limitada | Real | Real |
| Carso Construcción de Costa Rica, S. A. | Colon | US Dollar |
| Cicsa Colombia, S. A. | Colombian Peso | Colombian Peso |
| Carso Construcción de Dominicana, S. de R. L. (antes Cicsa Dominicana, S. A.) | Dominican Peso | Dominican Peso |
| Cicsa Ingeniería y Construcción Chile Ltda., S. de R. L. | Chilean Peso | Chilean Peso |
| Tabasco Oil Company, LLC., sucursal en Colombia | Colombian Peso | US Dollar |
| Cicsa Perú, S. A. C. | Nuevo Sol | Nuevo Sol |
| Condutel Austral Comercial e Industrial, Limitada | Chilean Peso | Chilean Peso |
| Cometel de Centroamérica, S. A. | Quetzal | Quetzal |
| Cometel de Honduras, S. A. | Lempira | Lempira |
| Cometel de Nicaragua, S. A. | Cordoba | Cordoba |
| Cupro do Brasil, Limitada | Real | Real |
| Grupo Sanborns Internacional, S. A. (Panamá) | US Dollar | US Dollar |
| Ideal Panama, S. A. | Balboa | Balboa |
| Nacel de Centroamérica, S. A. | Quetzal | Quetzal |
| Nacel de Honduras, S. A. | Lempira | Lempira |
| Nacel de Nicaragua, S. A. | Cordoba | Cordoba |
| Nacel de El Salvador, S. A. | US Dollar | US Dollar |
| Procisa Ecuador, S. A. | US Dollar | US Dollar |
| Procisa do Brasil Projetos, Construcoes e Instalacoes, Ltd. | Real | Real |
| Procosertel, S. A. | Argentine Peso | Argentine Peso |
| Procosertel Uruguay, S. A. | Uruguayan Peso | Uruguayan Peso |
| Corporación de Tiendas Internacionales, S. A. de C. V. (El Salvador) | US Dollar | US Dollar |
| Carso Energy Corp. | US Dollar | US Dollar |
| Carso Gasoducto Norte, S. A. de C. V. | Mexican Peso | US Dollar |
| Plycem Construsistemas Honduras, S. A. de C. V. | Lempiras | Lempiras |
| Plycem Construsistemas El Salvador, S. A. de C. V. | US Dollar | US Dollar |
| Plycem Construsistemas Costa Rica, S. A. de C. V. | Colon | Colon |
| Plycem Construsistemas Centroamerica, S. A. | Panamanian Balboa | Panamanian Balboa |
| The Plycem Company Inc. | Panamanian Balboa | Panamanian Balboa |
| Eternit Colombiana, S. A. | Colombian Peso | Colombian Peso |
| Eternit Ecuatoriana, S. A. | US Dollar | US Dollar |
| Industrias Duralit, S. A. | Bolivian Pesos | Bolivian Pesos |
| Industrias Fibraforte, S. A. | Soles | Soles |
| Nacobre USA | US Dollar | US Dollar |
| Plycem USA Inc. | US Dollar | US Dollar |
| Maxitile Inc. | US Dollar | US Dollar |
| Cementos Colombianos, S. A. S. | Colombian Peso | Colombian Peso |
| Lemus Asociados, S. A. de C. V. | US Dollar | US Dollar |
| Elementia USA | US Dollar | US Dollar |
| Elementia USA LLC | US Dollar | US Dollar |
| Inversiones Rocky Point, S. A. | Colombian Peso | Colombian Peso |
| Desarrollos Industriales Revolución DIR, S. A. | Colon | Colon |
| Fortaleza USA | US Dollar | US Dollar |
| Desarrollos Industriales Revolución DIR El Salvador, S. A. | US Dollar | US Dollar |
| Proyectos Mesoamérica, S. A. | US Dollar | US Dollar |
| MX DLTA NRG 1, S. A. de C. V. | Mexican Peso | US Dollar |

- Borrowing costs - Borrowing costs directly attributable to the acquisition, construction, or production of qualifying assets, which are assets that require a substantial period of time until they are ready for use or sale, were added to the cost of those assets during that time until they are substantially ready for use or sale.
- Income earned from the temporary investment of specific loan funds pending use in qualifying assets is deducted from the cost of loans eligible to be capitalized.
All other borrowing costs are recognized in profit or loss during the period in which they are incurred.
- Direct employee and retirement benefits and Employee Profit Sharing (PTU) - Direct benefit and defined retirement benefit costs are recognized as expenses at the time employees have rendered the services that entitle them to contributions.
The seniority bonus liability of all staff and the pension liability of non-unionized staff and retirement payments that resemble a pension are considered in defined benefit plans, the cost of such benefits being determined using the projected unit credit method, with actuarial valuations being made at the end of each reporting period. Actuarial gains and losses are recognized immediately in the other items of comprehensive income net of your deferred tax, according to the asset or liability recognized in the consolidated statement of financial position, to reflect the surplus (or deficit) of the employee benefit plan; while the costs of past services are recognized in profit or loss when the plan is modified or when restructuring costs are recognized.
Retirement benefit obligations recognized in the consolidated statement of financial position represent the value of the defined benefit obligation, adjusted for actuarial gains and losses and past service costs, less the fair value of plan assets. When the plan's assets are greater than the plan's defined benefit liabilities, the asset will be valued at the lesser of: (i) the surplus in the defined benefit plan, and (ii) the present value of any economic benefits available in the form of redemptions from the plan or reductions in future contributions to the plan.
PTU
The PTU is recorded in the results of the year in which it is caused.
As a result of the Income Tax Law (LISR) of 2014, as of December 31, 2025, 2024 and 2023, the PTU is determined based on the tax profit in accordance with section I of Article 10 of the same Law.
- Income taxes - Income tax expense represents the sum of the income taxes incurred and the deferred income taxes.
- Income taxes incurred
The tax caused calculated corresponds to the income tax (ISR) and is recorded in the results of the year in which it is caused.
The tax due is payable on the taxable basis of the year. Taxable income differs from net income as reported in profit or loss because it excludes components of income or expenses that are cumulative or deductible in other years and excludes components that have never been cumulative or deductible. The Entity's liabilities for taxes incurred are calculated using the tax rates that have been decreed at the end of the reporting period.
A provision is recognized for those reasons in which the determination of the tax is uncertain, but it is considered probable that there will be a future outflow of funds for a tax authority. Provisions are valued at the best amount that is expected to become payable. The assessment is based on the judgement of tax experts supported by the Entity's previous experiences in tax activities and in some cases based on the consultation of an independent tax specialist.
- Deferred income taxes
Deferred income taxes are recognized on the temporary differences between the carrying amount of the assets and liabilities included in the financial statements and the corresponding tax bases used to determine the tax result, applying the rate corresponding to these differences and, where applicable, including the benefits of tax losses to be amortized and some tax credits. The deferred income tax asset or liability is generally recognized for all temporary tax differences. A deferred tax asset shall be recognised for all deductible temporary differences to the extent that it is likely that the Entity will have future taxable profits against which it can apply those deductible temporary differences. These assets and liabilities are not recognised if the temporary differences arise from goodwill or the initial recognition (other than from the business combination) of other assets and liabilities in a transaction that does not affect tax or accounting results.
A deferred tax liability for taxable temporary differences associated with investments in subsidiaries and associates, and interests in joint ventures, is recognized, except when the Entity is able to control the reversal of the temporary difference and when it is probable that the temporary difference will not be reversed in the foreseeable future. Deferred tax assets arising from temporary differences associated with such investments and interests are recognized only to the extent that it is probable that there will be sufficient future taxable profits against which those temporary differences are used and are expected to reverse them in the near future.
The carrying amount of a deferred tax asset should be reviewed at the end of each reporting period and should be reduced to the extent that it is considered likely that there will not be sufficient taxable profits to allow all or part of the asset to be recovered.
Deferred tax assets and liabilities are valued using the tax rates expected to apply in the period in which the liability is paid or the asset is realized, based on the rates (and tax laws) that have been approved or substantially approved at the end of the reporting period.
The valuation of deferred tax liabilities and assets reflects the tax consequences that would arise from the manner in which the Entity expects, at the end of the reporting period, to recover or settle the carrying amount of its assets and liabilities.
For purposes of measuring deferred tax liabilities and assets for investment properties using the fair value model, it is estimated that the carrying amount of such properties should be recovered in full through sale.
- Taxes incurred and deferred
Taxes accrued and deferred are recognized as expense or income in profit or loss, except when they relate to items that are recognized outside profit or loss, either in other comprehensive income or directly in stockholders' equity, in which case the tax is also recognized outside profit or loss; or when they arise from the initial recognition of a business combination, the tax effect is included within the recognition of the business combination.
- Consolidated statements of cash flows - Cash flow is determined by applying the indirect method for the presentation of cash flows from operating activities, so consolidated net income for the year is adjusted for items that did not require or use cash flows, as well as flows corresponding to investing and financing activities. The interest charged is presented as operating activities and the interest paid as financing activities.
- Earnings per share - Basic earnings per common share is calculated by dividing the consolidated net income of the controlling interest by the weighted average of common shares outstanding during the year. As of December 31, 2025, 2024 and 2023, the Entity does not hold ordinary shares with the potential for dilutive effects.
37. Critical accounting judgments and key sources of uncertainty in estimates
In applying the accounting policies described in Note 35, the Entity’s management makes judgments, estimates and assumptions about certain amounts of the assets and liabilities in the consolidated financial statements. The corresponding estimates and assumptions are based on historical experience and other factors that are considered relevant. Actual results may differ from those estimates.
The underlying estimates and assumptions are revised on a regular basis. Revisions to accounting estimates are recognized in the period of the revision and future periods if the revision affects both the current period and subsequent periods.
-
Critical judgments when applying accounting policies
The following are critical judgments, other than those involving estimates, made by management during the process of implementing the Entity’s accounting policies and that have a significant effect on the consolidated financial statements.- Tax-deferred investment properties
For purposes of evaluating the deferred tax liabilities or assets arising from the investment properties arising from the fair value model, the entity’s management has reviewed the portfolios of the Entity’s investment properties and concluded that the investment properties are not held under a business model in which their objective consumes all the economic benefits of the investment over time, instead of selling. Therefore, in determining the deferred taxes on the investment of property, the Entity’s management has determined the presumption to maintain the carrying amount assessed using the fair value model and recover all through the sale.
- Tax-deferred investment properties
- Key sources of uncertainty in estimates
Key assumptions regarding the future and other key sources of uncertainty in the estimates at the end of the period, which have a significant risk of resulting in material adjustments in the carrying values of assets and liabilities over the next year, are discussed below.
Calculation of insolvency loss - When measuring the expected credit loss, the entity uses reasonable information, which is based on assumptions about future movements of different economic indicators and how these economic indicators will affect others.
The expected loss is an estimate of the expected loss due to non-payment. It is based on the difference between contractual cash flows and those that lenders expect to receive, taking into consideration cash flows from credit enhancements.
The probability of default is a key to measure the expected credit loss. The probability of default is an estimate of the probability given a time horizon, the calculation which includes historical data and expected assumptions of future conditions.
Impairment of long-lived assets - The carrying amount of non-current assets is reviewed for impairment in the event that there are situations or changes in circumstances that indicate that the carrying amount is not recoverable. If there are indications of impairment, a review is carried out to determine if the carrying amount exceeds its recovery value and is impaired. In performing asset impairment tests, the Entity is required to make estimates of the value in use assigned to its real estate, machinery and equipment, and to cash-generating units, for certain assets. Value-in-use calculations require the Entity to determine the future cash flows that should arise from the cash-generating units and an appropriate discount rate for calculating the present value. The Entity uses revenue cash flow projections using estimates of market conditions, pricing, and production and sales volumes.
Contingencies - The Entity is subject to judicial proceedings on which it evaluates the probability that they will materialize as a payment obligation, for which it considers the legal situation at the date of the estimate and the opinion of the legal advisors, such evaluations are periodically reconsidered.
Construction contract revenue recognition - When the results of a construction contract can be reliably estimated, revenues are recorded using the percentage of completion method based on costs incurred, taking into account the estimated costs and revenues at the end of the project, as the activity develops. Changes in the execution of the work, and in the estimated returns, including those that may arise from awards derived from the early completion of projects, conventional penalties and final agreements in the contracts, are recognized as income in the periods in which the reviews are made or approved by the clients.
Under the terms of several contracts, the revenue that is recognized is not necessarily related to amounts billable to customers. Management periodically evaluates the reasonableness of its accounts receivable. In cases where there are indications of difficulty in their recovery, additional reserves are established for doubtful accounts receivable, affecting the results of the year in which they are determined. The estimation of such reserve is based on the best judgment of the Entity considering the circumstances prevailing at the time of its determination.
Discount rate used to determine the Entity’s carrying value of the defined benefit obligation - The determination of the benefits of the obligations provided depends on a few assumptions, including the selection of the discount rate. The discount rate is set by reference to the market return at the end of the period in corporate bonds. Significant assumptions need to be made when setting the criteria for bonds and must be included in the yield curve. The most important criteria to consider in the selection of bonds include the current size of the corporate bonds, the quality and the identification of the guidelines that are excluded. These assumptions are considered key to the estimation of uncertainty as relatively insignificant changes, which may have a significant effect on the following year’s Financial Statements of the Entity.
38. Transactions that did not result in cash flows
During the year, the Entity entered into the following financing and investing activities that did not result in cash flows and that are not reflected in the consolidated statements of cash flows:
With the entry into force of IFRS 16, the amortization of rights of use are items that do not generate flows, as well as the interest for the recognition of the present value of the income determined at present value as of December 31, 2025, 2024 and 2023, the amounts generated are presented in the following table:
| Amounts recognized in the consolidated income statement | 2025 | 2024 | 2023 |
|---|---|---|---|
| Depreciation expense of the asset for rights of use | $ 1,342,951 | $ 1,973,903 | $ 1,470,877 |
| Financial expense caused by lease liabilities | 618,819 | 619,526 | 526,986 |
| Expense related to short-term leases | 91,879 | 218,532 | 181,152 |
39. Subsequent events
On January 30, 2026, GSM and DLTA1 signed a Mixed Contract with PEMEX, for the exploitation of the onshore field called Macavil in the state of Tabasco, under the title of assignment for mixed development ADM-E-004-Comalcalco-Macavil. The proceeds of such exploitation will be distributed among the 3 participants as determined in the contract and its validity is 20 years from the date of signing.
On January 19, 2026, Zamajal, S.A. de C.V. entered into a binding agreement with Lukoil International Upstream Holding B.V. and Lukoil International Holding GMBH (collectively “Lukoil”), so that, upon meeting certain conditions, including obtaining the corresponding governmental and corporate authorizations, it will acquire 100% of the capital stock of its subsidiary Fieldwood Mexico B.V., who in turn directly and indirectly owns 100% of the capital stock of, (i) Fieldwood Energy de México, S. de R.L. de C.V., and (ii) Fieldwood Energy E&P México, S. de R.L. de C.V. (“Fieldwood Mexico”) (the “Transaction”). Fieldwood Mexico is the “operator” and holder of the 50% interest in the Ichalkil & Pokoch fields (“Contract Area 4”), a contractual area located off the coast of Campeche.
40. Authorization of the issuance of the consolidated financial statements
The consolidated financial statements as of December 31, 2025, were authorized for issuance on March 20, 2026, by L. C. Arturo Spínola García, Chief Financial Officer of the Entity, consequently they do not reflect the events that occurred after that date, and are subject to the approval of the Entity’s Ordinary Shareholders’ Meeting, who may decide to modify it in accordance with the provisions of the General Law of Commercial Companies. The consolidated financial statements for the years ended December 31, 2024, were approved at the Ordinary General Shareholders’ Meeting held on April 30, 2025.